Tidy Data with tidyr
Day 3
Freie Universität Berlin @ Theoretical Ecology
Reproduce slides
Data tidying
- Structure data for visualisation and analysis
- Ca. 80% of time in data analysis
Idea of Tidy Data
Standardized data structure for easy and efficient data cleaning, visualization and analysis
What is tidy data?
Happy families are all alike; every unhappy family is unhappy in its own way — Leo Tolstoy
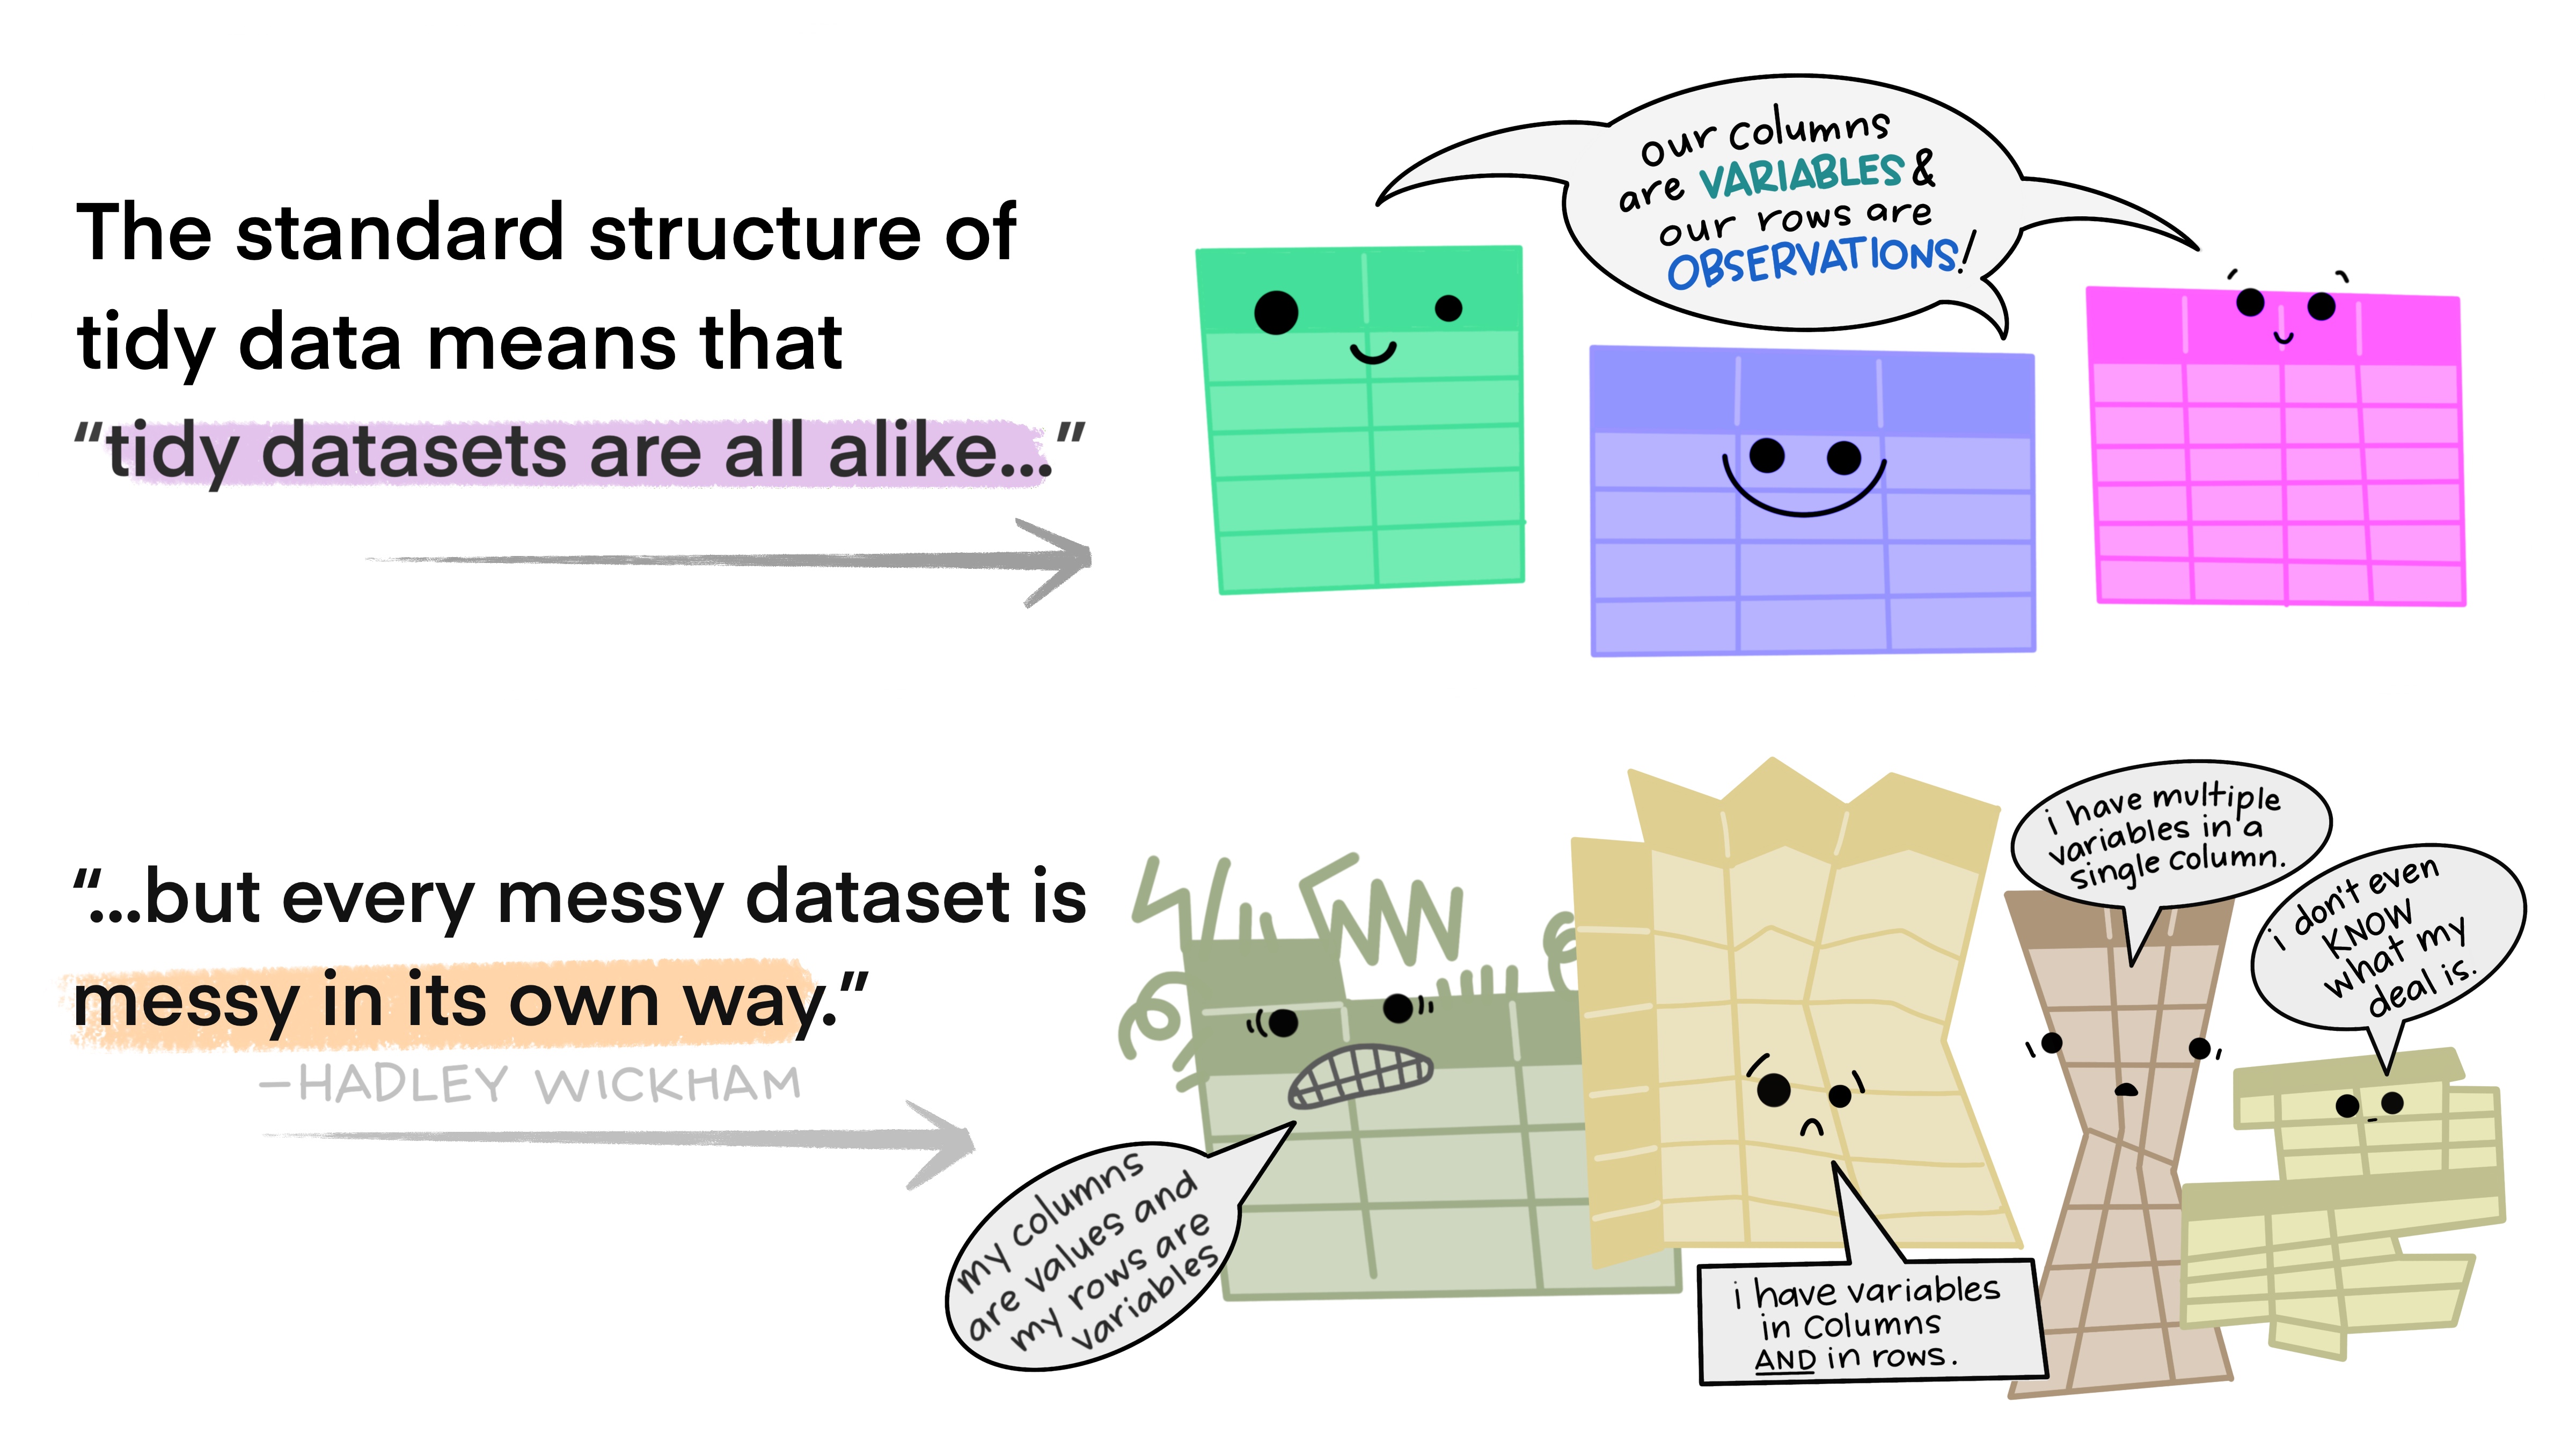
Illustration from the Openscapes blog Tidy Data for reproducibility, efficiency, and collaboration by Julia Lowndes and Allison Horst
How to structure data?
- Most statistical data sets: tables with rows and columns
- Columns: Often labelled
- Rows: sometimes labelled, sometimes not
- Example: Grades of students in some assessments
- Four row, four columns
# A tibble: 4 × 4
  name   quiz1 quiz2 test1
  <chr>  <chr> <chr> <chr>
1 Billy  <NA>  D     C
2 Suzy   F     <NA>  <NA>
3 Lionel B     C     B
4 Jenny A A B How to structure data?
# A tibble: 4 × 4
  name   quiz1 quiz2 test1
  <chr>  <chr> <chr> <chr>
1 Billy  <NA>  D     C
2 Suzy   F     <NA>  <NA>
3 Lionel B     C     B
4 Jenny A A B - Swap rows and columns
# A tibble: 3 × 5
  assessment Billy Suzy  Lionel Jenny
  <chr>      <chr> <chr> <chr>  <chr>
1 quiz1      <NA>  F     B      A
2 quiz2      D     <NA>  C      A
3 test1 C <NA> B B -
Which structure is better?
- Are both tidy?
- Both messy?
Terminology on data structure
- Dataset: collection of values
- Numbers (numeric)
- Strings (categorical)
-
Observations
- All values measured on the same object/unit
-
Variables
- Measure of the same attributes of the different units
Variables and observations in the example?
# A tibble: 4 × 4
  name   quiz1 quiz2 test1
  <chr>  <chr> <chr> <chr>
1 Billy  <NA>  D     C
2 Suzy   F     <NA>  <NA>
3 Lionel B     C     B
4 Jenny A A B - Variables
- Name
- Grade
- Assessment
- Observations
- Combinations of persons and assessments
The concept of tidy data

Illustration from the Openscapes blog Tidy Data for reproducibility, efficiency, and collaboration by Julia Lowndes and Allison Horst
Tidy classroom data
# A tibble: 12 × 3
   name   assessment grade
   <chr>  <chr>      <chr>
 1 Billy  quiz1      <NA>
 2 Billy  quiz2      D
 3 Billy  test1      C
 4 Jenny  quiz1      A
 5 Jenny  quiz2      A
 6 Jenny  test1      B
 7 Lionel quiz1      B
 8 Lionel quiz2      C
 9 Lionel test1      B
10 Suzy   quiz1      F
11 Suzy   quiz2      <NA>
12 Suzy   test1      <NA>
Caution
There is no unique answer what is a variable and observation. It depends on your questions.
Mini-exercise
- With your neighbour:
- Think about and example dataset from biology
- What are the observations?
- What are the variables?
- Is the distinction clear or are there other options?
- Briefly report to the group
Tidy the classroom data
- What is the problem in the data?
# A tibble: 4 × 4
  name   quiz1 quiz2 test1
  <chr>  <chr> <chr> <chr>
1 Billy  <NA>  D     C
2 Suzy   F     <NA>  <NA>
3 Lionel B     C     B
4 Jenny A A B - Values of the variable assessment in column header
- We need a table with more rows and less columns –> longer format
Using tidyr::pivot_longer
# A tibble: 4 × 4
  name   quiz1 quiz2 test1
  <chr>  <chr> <chr> <chr>
1 Billy  <NA>  D     C
2 Suzy   F     <NA>  <NA>
3 Lionel B     C     B
4 Jenny A A B ![]()
classroom2 <- classroom %>%
  pivot_longer(quiz1:test1,
               names_to = "assessment",
               values_to = "grade") %>%
  arrange(name, assessment)
classroom2
# A tibble: 12 × 3
name assessment grade
<chr> <chr> <chr>
1 Billy quiz1 <NA>
2 Billy quiz2 D
3 Billy test1 C
4 Jenny quiz1 A
5 Jenny quiz2 A
6 Jenny test1 B
7 Lionel quiz1 B
8 Lionel quiz2 C
9 Lionel test1 B
10 Suzy quiz1 F
11 Suzy quiz2 <NA>
12 Suzy test1 <NA> Tidying messy datasets
The most common problems with messy datasets
- Column header are values, not variable names
- Multiple variables are stored in one column
- Variables are stored in both rows and columns
- A single observational unit is stored in multiple tables.
A messy example data set
Data generation code
cities_v <- c("Istanbul", "Moscow", "London", "Saint Petersburg", "Berlin", "Madrid", "Kyiv", "Rome", "Bucharest", "Paris")
population <- c(15.1e6, 12.5e6, 9e6, 5.4e6, 3.8e6, 3.2e6, 3e6, 2.8e6, 2.2e6, 2.1e6)
area_km2 <- c(2576, 2561, 1572, 1439,891,604, 839, 1285, 228, 105 )

country <- c("Turkey", "Russia", "UK", "Russia", "Germany", "Spain",
                        "Ukraine", "Italy", "Romania", "France")
# tidy dataset
cities_tidy <- tibble(city = cities_v,
           population = population,
           area_km2 = area_km2,
           country = country)

# make untidy
cities_untidy <- cities_tidy %>%
  unite(col = "location", c("country", "city")) %>%
  pivot_longer(c("population", "area_km2"), names_to = "type") %>%
  pivot_wider(names_from = "location", values_from = "value")

# print in nice format
cities_untidy %>% knitr::kable()| type | Turkey_Istanbul | Russia_Moscow | UK_London | Russia_Saint Petersburg | Germany_Berlin | Spain_Madrid | Ukraine_Kyiv | Italy_Rome | Romania_Bucharest | France_Paris |
|---|---|---|---|---|---|---|---|---|---|---|
| population | 15100000 | 12500000 | 9000000 | 5400000 | 3800000 | 3200000 | 3000000 | 2800000 | 2200000 | 2100000 |
| area_km2 | 2576 | 2561 | 1572 | 1439 | 891 | 604 | 839 | 1285 | 228 | 105 |
- What are the observations and variables here?
- In which way is this data messy?
Structure of the messy data
# A tibble: 2 × 11
  type       Turkey_Istanbul Russia_Moscow UK_London `Russia_Saint Petersburg`
  <chr>                <dbl>         <dbl>     <dbl>                     <dbl>
1 population        15100000      12500000   9000000                   5400000
2 area_km2              2576          2561      1572                      1439
# ℹ 6 more variables: Germany_Berlin <dbl>, Spain_Madrid <dbl>,
#   Ukraine_Kyiv <dbl>, Italy_Rome <dbl>, Romania_Bucharest <dbl>,
# France_Paris <dbl>- Observations
- Cities
- Variables
- Country
- City names
- Population
- Area
Structure of the messy data
# A tibble: 2 × 11
  type       Turkey_Istanbul Russia_Moscow UK_London `Russia_Saint Petersburg`
  <chr>                <dbl>         <dbl>     <dbl>                     <dbl>
1 population        15100000      12500000   9000000                   5400000
2 area_km2              2576          2561      1572                      1439
# ℹ 6 more variables: Germany_Berlin <dbl>, Spain_Madrid <dbl>,
#   Ukraine_Kyiv <dbl>, Italy_Rome <dbl>, Romania_Bucharest <dbl>,
#   France_Paris <dbl>
What is not tidy here?
- Country and city variables are split into multiple columns
- Country and city variable values are united to one value
- Variables in rows
- Each row has multiple observation
Tip
Let’s tidy this data using functions from the tidyr package!
pivot_longer()
One variable split into multiple columns can be solved with pivot_longer
step1 <- pivot_longer(
    cities_untidy,                         # the tibble
    cols = Turkey_Istanbul:France_Paris,   # the columns to pivot from:to
    names_to = "location",                 # name of the new column
    values_to = "value")                   # name of the value column
# A tibble: 20 × 3
type location value
<chr> <chr> <dbl>
1 population Turkey_Istanbul 15100000
2 population Russia_Moscow 12500000
3 population UK_London 9000000
4 population Russia_Saint Petersburg 5400000
# ℹ 16 more rowsAnother way to select the columns to pivot:
separate_wider_delim()
Multiple variable values that are united into one can be separated using separate_wider_delim
step2 <- separate_wider_delim(
  step1,                        # the tibble
  location,                     # the column to separate
  delim = "_",                  # the separator
  names = c("country", "city")) # names of new columns
# A tibble: 20 × 4
type country city value
<chr> <chr> <chr> <dbl>
1 population Turkey Istanbul 15100000
2 population Russia Moscow 12500000
# ℹ 18 more rowsThe opposite function exists as well and is called unite. Check out ?unite for details.
pivot_wider()
One observation split into multiple rows can solved with pivot_wider
summary(step2) type country city value
area_km2 :10 Russia :4 Berlin :2 Min. : 105
population:10 France :2 Bucharest:2 1st Qu.: 1186
Germany:2 Istanbul :2 Median : 1051288
Italy :2 Kyiv :2 Mean : 2955605
Romania:2 London :2 3rd Qu.: 3350000
Spain :2 Madrid :2 Max. :15100000
(Other):6 (Other) :8 step3 <- pivot_wider(
step2, # the tibble
names_from = type, # the variables
values_from = value) # the values# A tibble: 10 × 4
country city population area_km2
<fct> <fct> <dbl> <dbl>
1 Turkey Istanbul 15100000 2576
2 Russia Moscow 12500000 2561
3 UK London 9000000 1572
4 Russia Saint Petersburg 5400000 1439
5 Germany Berlin 3800000 891
# ℹ 5 more rowsNow, we have a tidy data set!!!
All steps in one call
We can also use a pipe to do all these steps in one:
cities_tidy <- cities_untidy %>%
  pivot_longer(
    Turkey_Istanbul:France_Paris,
    names_to = "location",
    values_to = "values"
  ) %>%
  separate_wider_delim(
    location,
    delim = "_",
    names = c("country", "city")
  ) %>%
  pivot_wider(
    names_from = type,
    values_from = values
  )
Exercise
Now it is your turn!
Tidy Data with tidyr