Final tasks and exercises
Day 9
Felix May
Freie Universität Berlin @ Theoretical Ecology
Agenda
1. Information on the final report
2. Exercises on linear and generalized linear models
- Same structure and type of tasks as final report
3. Feedback on the course
4. Distribution of final tasks
Your independent tasks and report
- 2 people per group (1 or 3 in exceptions)
- In English
- Ca. 3 pages of text plus graphics (max. 4) and tables (max. 2)
- Do not include tables of raw data
- Add captions to your graphics and tables
- Do graphics in R (of course!)
- Give R version in text, ask R how to cite:
citation() - Describe methods universally and not in R specific language
Tip
Read some current biological articles and do it the same way (just shorter)
Structure of the report
- Introduction:
- Short
- Describe what you know about the context of the data
- Explain research question(s) and/or hypotheses
- Methods:
- Describe what you know about the collection of the data
- Mainly describe statistical methods
- Results:
- Explain what you found
- Rather little text, refer to figures and/or tables!
Structure of the report
- Discussion:
- Interpret the results with respect to the questions/hypotheses
- Potentially compare your findings with studies you know
- Literature
- Cite all references that you used
- R code:
- Hand in, too!
- With comprehensive comments explaining what you did
Structure of the report
- Declaration that you did the analysis and report by yourself and without the help of generative AI tools
- We will circulate a template for the declaration
- Upload a pdf or word file and the R code (*.R-file) in Blackboard
- Check deadline on Blackboard: 3.5 weeks from now
Hints for Methods section:
Important points when you describe the data and statistical analyses:
- What is the response variable?
- What are the potential predictor variables?
- What is the sample size?
- Which models and/or which tests did you use?
- In case of GLMs:
- Which error distribution did you use and why?
- Which link function was used?
- Did you check for overdispersion?
- If you detected overdispersion, how did you deal with it?
Criteria for grading
Introduction (10%)
- Short motivation of the research question
- Goals of the study
- Clear questions and/or hypotheses
Methods (40%)
- Short introduction of the data, and the models including a description of error distribution etc.
- Reproducible R code (we should be able to run the code)
- Agreement between R code and its description in the text
- Sound methods corresponding to the data and their distribution
Criteria for grading
Results (40%)
- Precise description of the results
- Proper graphical visualisation
- Are all relevant results (in terms of the research question) presented?
Discussion (10%)
- Biological interpretation of the results
- Link to the research question
- Link to the context of the study
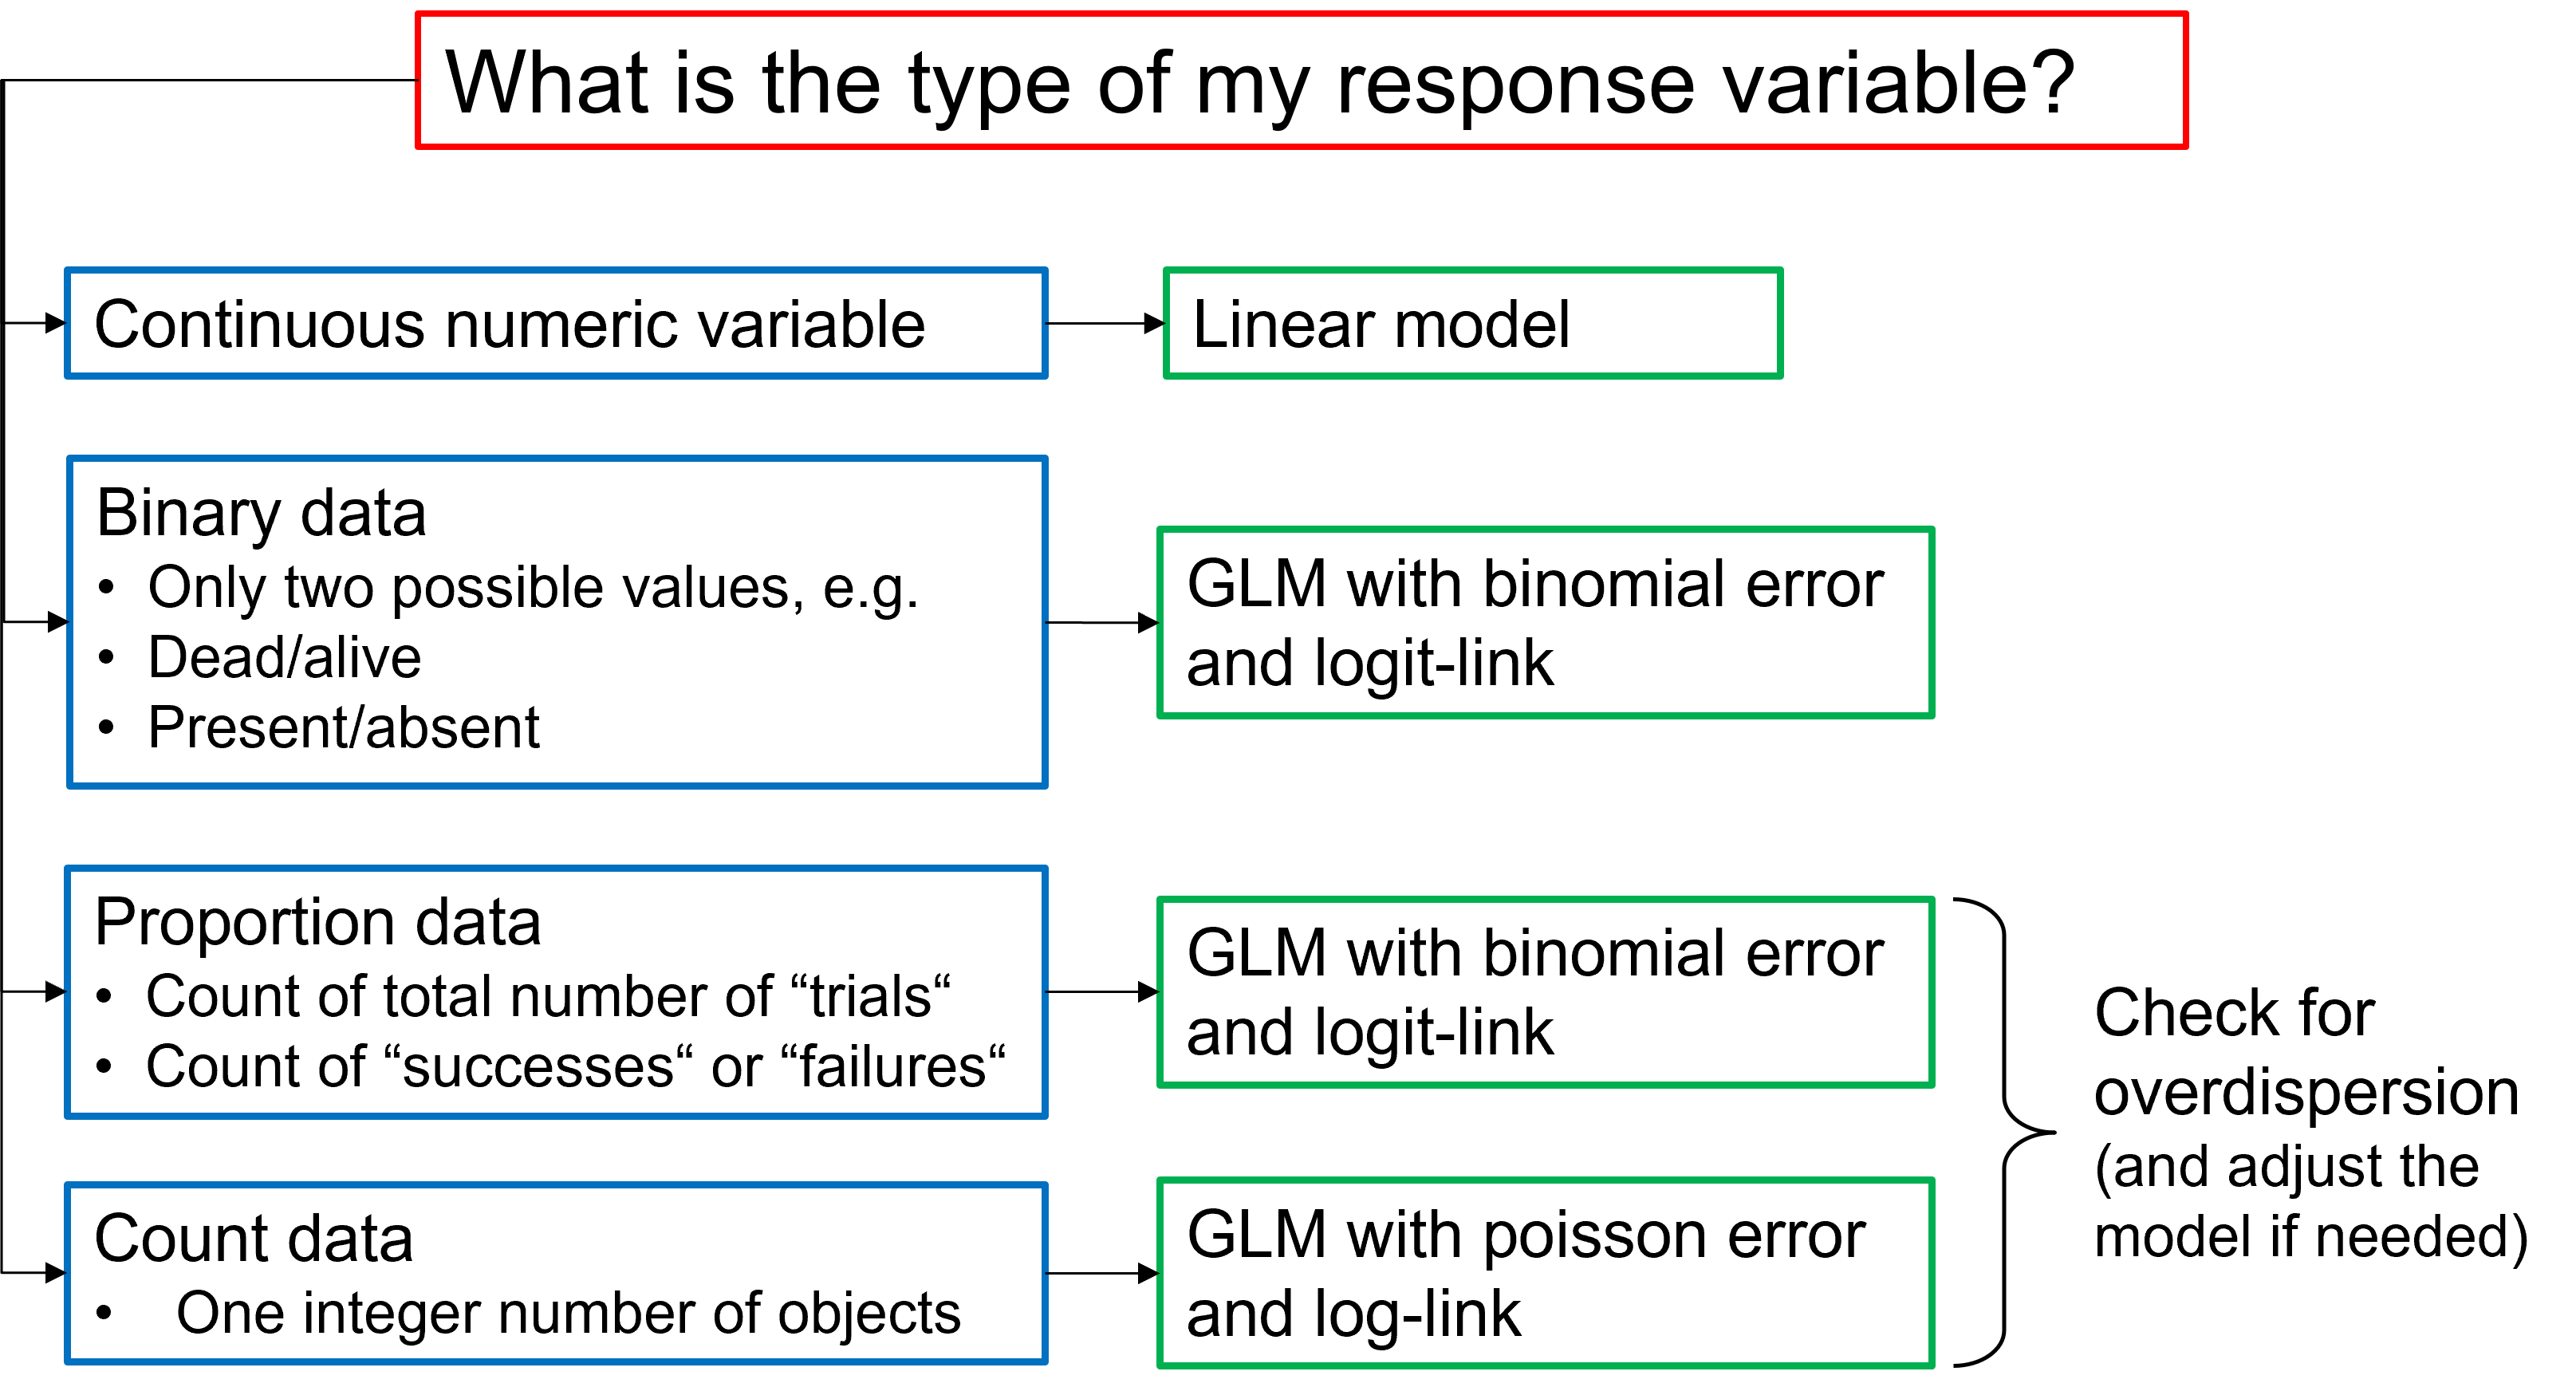
Select the appropriate model type
Practicing data analysis
- Choose one (or both) of the following exercises
- Analyse the data as you would do it for the exam
- Create comprehensive figures
- Be ready to present your analyses in the seminar
- Can be done in RStudio directly, no need to prepare slides (but feel free to do so when you have time and motivation)
- Bring general questions on data analysis for the seminar!
Graphics first
Recommendation: Always plot your data, before you start modelling!
Tasks & exercises