Creates a basic ggplot2 visualization of a landscape object.
Usage
# S3 method for class 'landscape'
plot(x, ...)
Arguments
- x
A landscape object created by
landscape.- ...
Additional arguments passed to ggplot2 functions.
Details
This function creates a minimal ggplot2 visualization of the landscape raster data.
The returned plot can be further customized by adding ggplot2 elements or by using
the plot_landscape function for higher-level customization.
See also
Other landscape objects:
landscape(),
print.landscape(),
set_landscape_name(),
set_landscape_pattern()
Examples
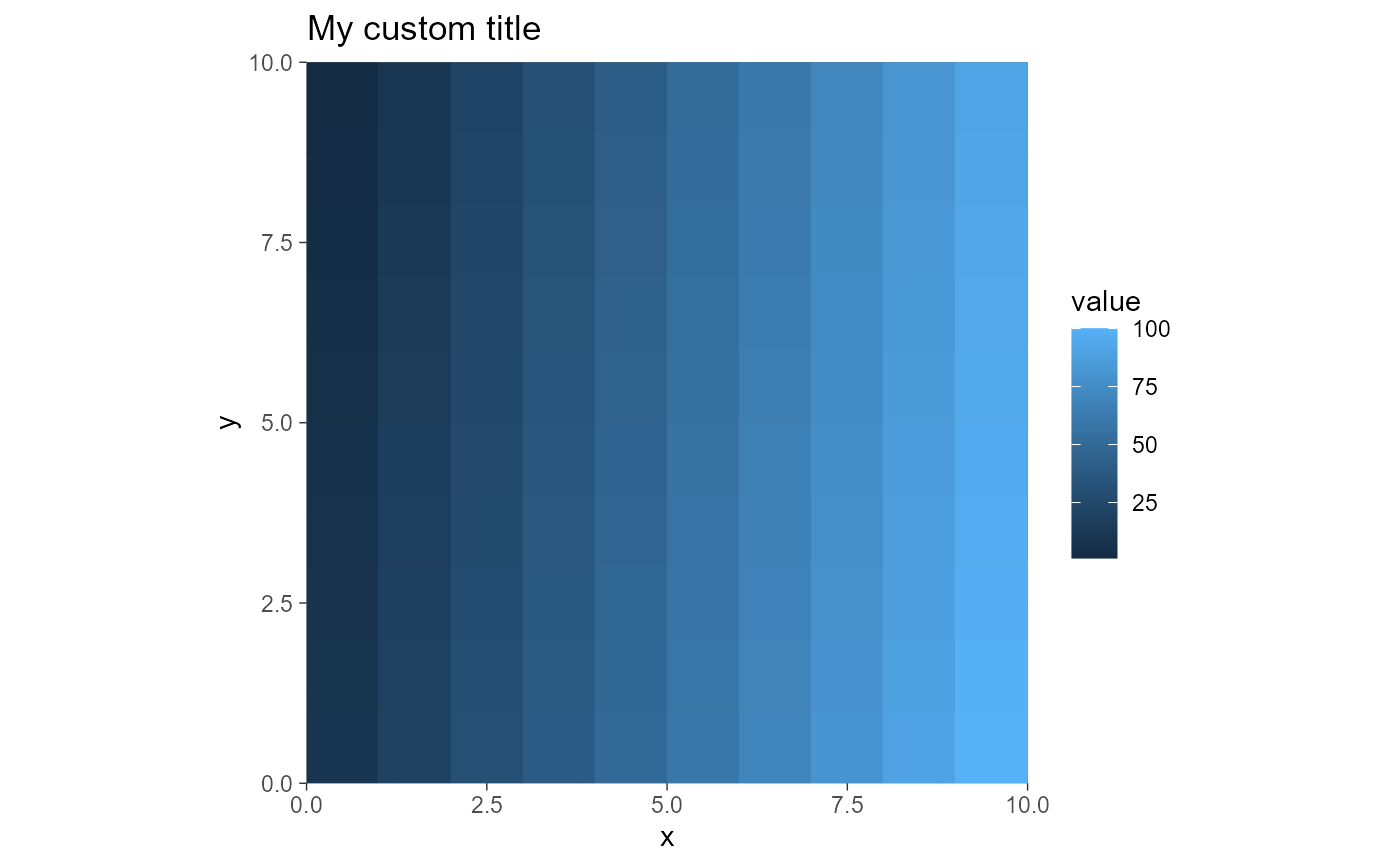
# Create a landscape
mat <- matrix(1:100, 10, 10)
l <- landscape(mat, pattern = "test", name = "example")

# Get basic plot
p <- plot(l)

# Add your own customization
p + ggplot2::ggtitle("My custom title") +
    ggplot2::theme_dark()