
Plot Neural Network Classification Landscapes
Source:R/plot_classification.R
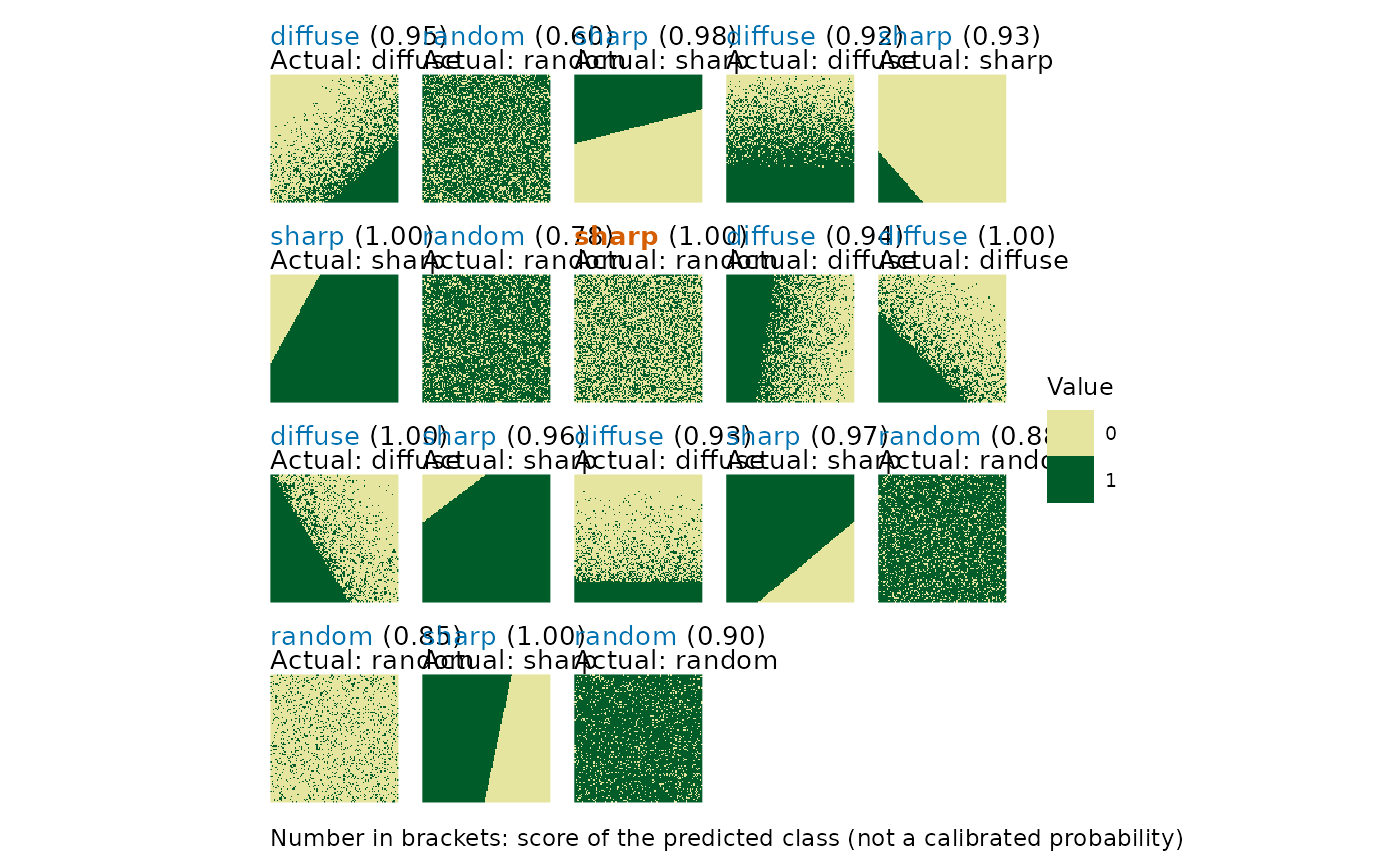
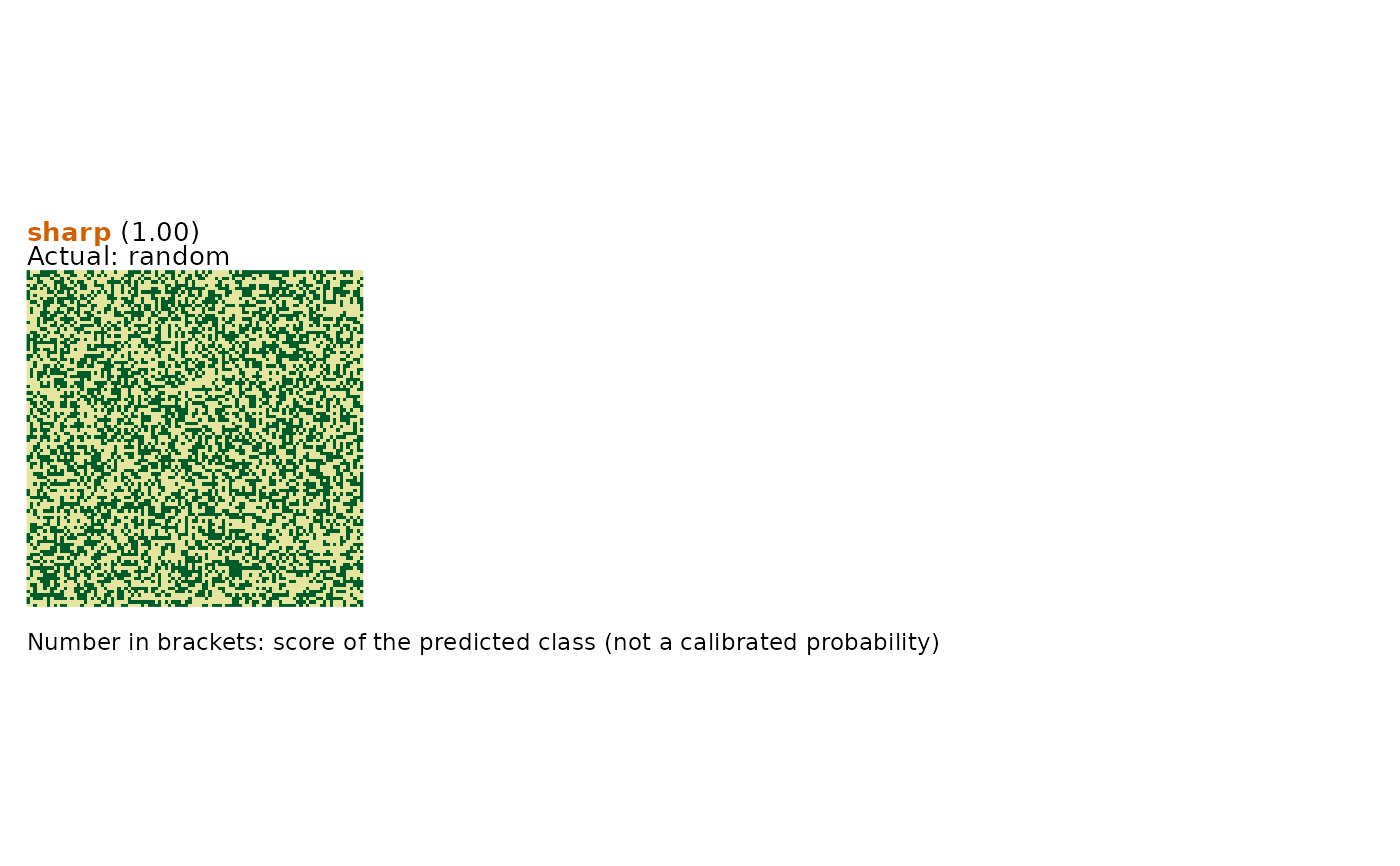
plot_classified_landscapes.RdPlots landscapes with neural network classification results, highlighting correct and misclassified cases. Optionally, only misclassified landscapes can be shown.
Usage
plot_classified_landscapes(
  classification,
  landscapes,
  only_misclassified = FALSE,
  score_note = TRUE,
  subset_index = NULL,
  ...
)
Arguments
- classification
A data frame with columns:
landscape_id,actual_class,predicted_class, andscore. Can be obtained from the CV-fold results oftrain_metric_model/train_pixel_modelor the output ofapply_metric_model/apply_pixel_model.- landscapes
A list of landscape objects corresponding one-to-one and in the same order as the rows in `classification`. The easiest way to ensure this is to use the same list of landscapes for both training and plotting.
- only_misclassified
Logical; if
TRUE, only misclassified landscapes are plotted. Default isFALSE. If every landscape was classified correctly there is nothing to plot: the function reports this with a message and returns an empty placeholder plot. Landscapes whose true class is unknown are not counted as misclassified.- score_note
Logical; if
TRUE(default), a one-line caption is added under the whole figure stating that the bracketed number is the score of the predicted class and not a calibrated probability. Set toFALSEwhen the surrounding figure caption already says so.- subset_index
Integer vector. Which of the plotted landscapes to show, e.g. to keep a large figure readable. Indexes the rows of
classificationthat would otherwise be plotted, so withonly_misclassified = TRUEit selects among the misclassified ones. DefaultNULLplots all of them.- ...
Additional arguments passed to
plot_landscapes, such asshow_legend,legend_title,ncol,max_landscapes, orforce.
Value
A patchwork object combining landscape plots with classification
annotations. With only_misclassified = TRUE and no misclassified
landscape, an empty placeholder plot carrying that message.
See also
train_pixel_model, train_metric_model
Other visualization:
plot_landscapes(),
plot_metrics()
Examples
# \donttest{
# Generate training landscapes
landscapes <- create_landscapes(
n = 18,
patterns = c("random", "sharp", "diffuse")
)
#> ✔ Successfully generated all 18 training landscapes
# Calculate landscape metrics
metrics <- calculate_metrics(landscapes, level = "landscape")
#> ■■■■■■■■■■ 30% | ETA: 7s
#> ■■■■■■■■■■■■■■■ 47% | ETA: 7s
#> ■■■■■■■■■■■■■■■■■■■ 59% | ETA: 6s
#> ■■■■■■■■■■■■■■■■■■■■■■■■■■■ 88% | ETA: 2s
# Find the best 5 metrics for classification
best_5 <- evaluate_metrics(metrics, metrics_number = 5)
#> Warning: Excluded 6 metrics with missing values (108 rows removed).
#> ✖ NA value for at least one landscape: "enn_cv", "enn_mn", "enn_sd", "iji",
#> "pafrac", and "rpr"
#> ℹ Use `exclude_incomplete_metrics = FALSE` to retain them (not recommended for
#> model training).
#> Warning: Excluded 3 metrics with no variation across landscapes: "pr", "prd", and "ta"
# Cross-validation produces the held-out predictions this plot needs.
# Only 2 folds, as each fold needs at least 3 landscapes per pattern.
model <- train_metric_model(
metrics,
metrics_selected = best_5,
cv_method = "k-fold",
cv_folds = 2
)
#> ℹ Low sample-to-predictor ratio (3.6:1). Consider LOO CV or reducing features.
#>
#> ── Cross-validation results ──
#>
#> ℹ Method: 2-fold cross-validation
#> ℹ Overall accuracy: 94.44%
#>
#> ── Confusion matrix
#> Actual
#> Predicted diffuse random sharp
#> diffuse 6 0 0
#> random 0 5 0
#> sharp 0 1 6
#>
#> ── Per-class performance
#> # A tibble: 3 × 5
#> class count recall precision f1_score
#> <chr> <dbl> <dbl> <dbl> <dbl>
#> 1 diffuse 6 1 1 1
#> 2 random 6 0.83 1 0.91
#> 3 sharp 6 1 0.86 0.92
# Plot all classification results
plot_classified_landscapes(
model$performance$validation_results,
landscapes
)
 # Show only misclassifications without legend
plot_classified_landscapes(
model$performance$validation_results,
landscapes,
only_misclassified = TRUE,
show_legend = FALSE,
ncol = 4
)
# Show only misclassifications without legend
plot_classified_landscapes(
model$performance$validation_results,
landscapes,
only_misclassified = TRUE,
show_legend = FALSE,
ncol = 4
)
 # }
# }