Creates a visualization of landscape metric values across landscape types using boxplots with overlaid jittered points. Metrics are displayed in separate facets.
Arguments
- metrics
Data frame from
calculate_landscape_metrics. Must contain columns: "level", "pattern", "metric", and "value". For class-level metrics, must also contain "class".- selected_metrics
Character vector of metric names to visualize. Must be present in the metrics data. If NULL (default), all available metrics are plotted in alphabetical order, subject to automatic limits based on the number of patterns.
- force
Logical. Override automatic metric limits (default: FALSE). When TRUE, all selected metrics will be plotted regardless of readability.
Details
The function automatically limits the number of metrics based on the number of patterns to maintain readability: - 1-3 patterns: up to 12 metrics (3 rows x 4 columns) - 4-5 patterns: up to 8 metrics (2 rows x 4 columns) - 6+ patterns: up to 6 metrics (2 rows x 3 columns)
Examples
landscapes <- create_landscapes(n = 20, patterns = c("labyrinth", "spots"))
#> ✔ Successfully generated all 20 training landscapes
metrics <- calculate_landscape_metrics(landscapes, level = "landscape")
#> ■■■■■■■■■■■■■■ 44% | ETA: 4s
#> ■■■■■■■■■■■■■■■■■■■■■■■ 73% | ETA: 2s
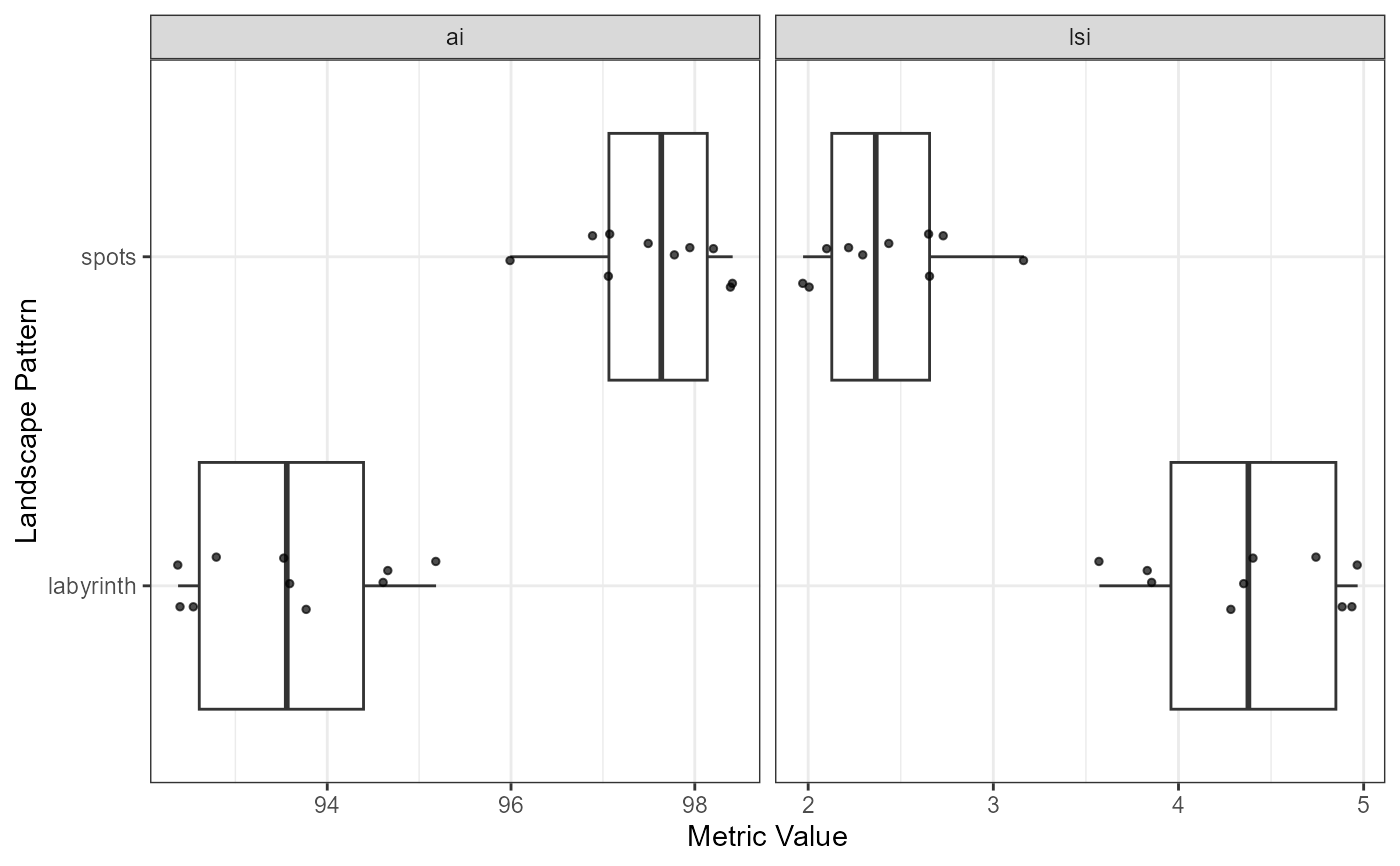
plot_metrics(metrics, selected_metrics = c("ai", "lsi"))
 # With many patterns and metrics, automatic limiting applies
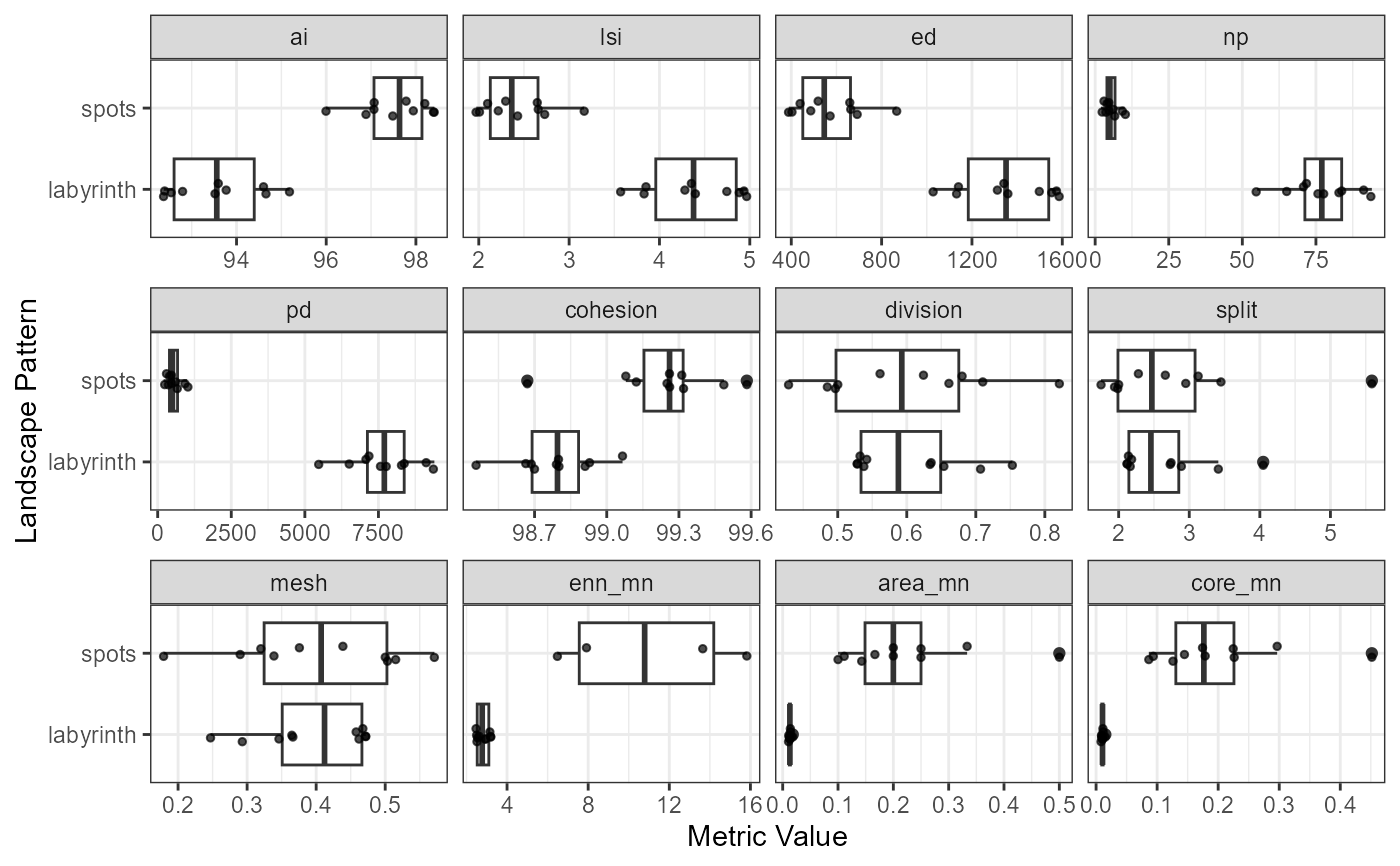
many_metrics <- c("ai", "lsi", "ed", "np", "pd", "cohesion", "division",
"split", "mesh", "enn_mn", "area_mn", "core_mn")
plot_metrics(metrics, selected_metrics = many_metrics)
#> Warning: Removed 6 rows containing non-finite outside the scale range
#> (`stat_boxplot()`).
#> Warning: Removed 6 rows containing missing values or values outside the scale range
#> (`geom_point()`).
# With many patterns and metrics, automatic limiting applies
many_metrics <- c("ai", "lsi", "ed", "np", "pd", "cohesion", "division",
"split", "mesh", "enn_mn", "area_mn", "core_mn")
plot_metrics(metrics, selected_metrics = many_metrics)
#> Warning: Removed 6 rows containing non-finite outside the scale range
#> (`stat_boxplot()`).
#> Warning: Removed 6 rows containing missing values or values outside the scale range
#> (`geom_point()`).
 # Override limits if needed
plot_metrics(metrics, selected_metrics = many_metrics, force = TRUE)
#> Warning: Removed 6 rows containing non-finite outside the scale range
#> (`stat_boxplot()`).
#> Warning: Removed 6 rows containing missing values or values outside the scale range
#> (`geom_point()`).
# Override limits if needed
plot_metrics(metrics, selected_metrics = many_metrics, force = TRUE)
#> Warning: Removed 6 rows containing non-finite outside the scale range
#> (`stat_boxplot()`).
#> Warning: Removed 6 rows containing missing values or values outside the scale range
#> (`geom_point()`).