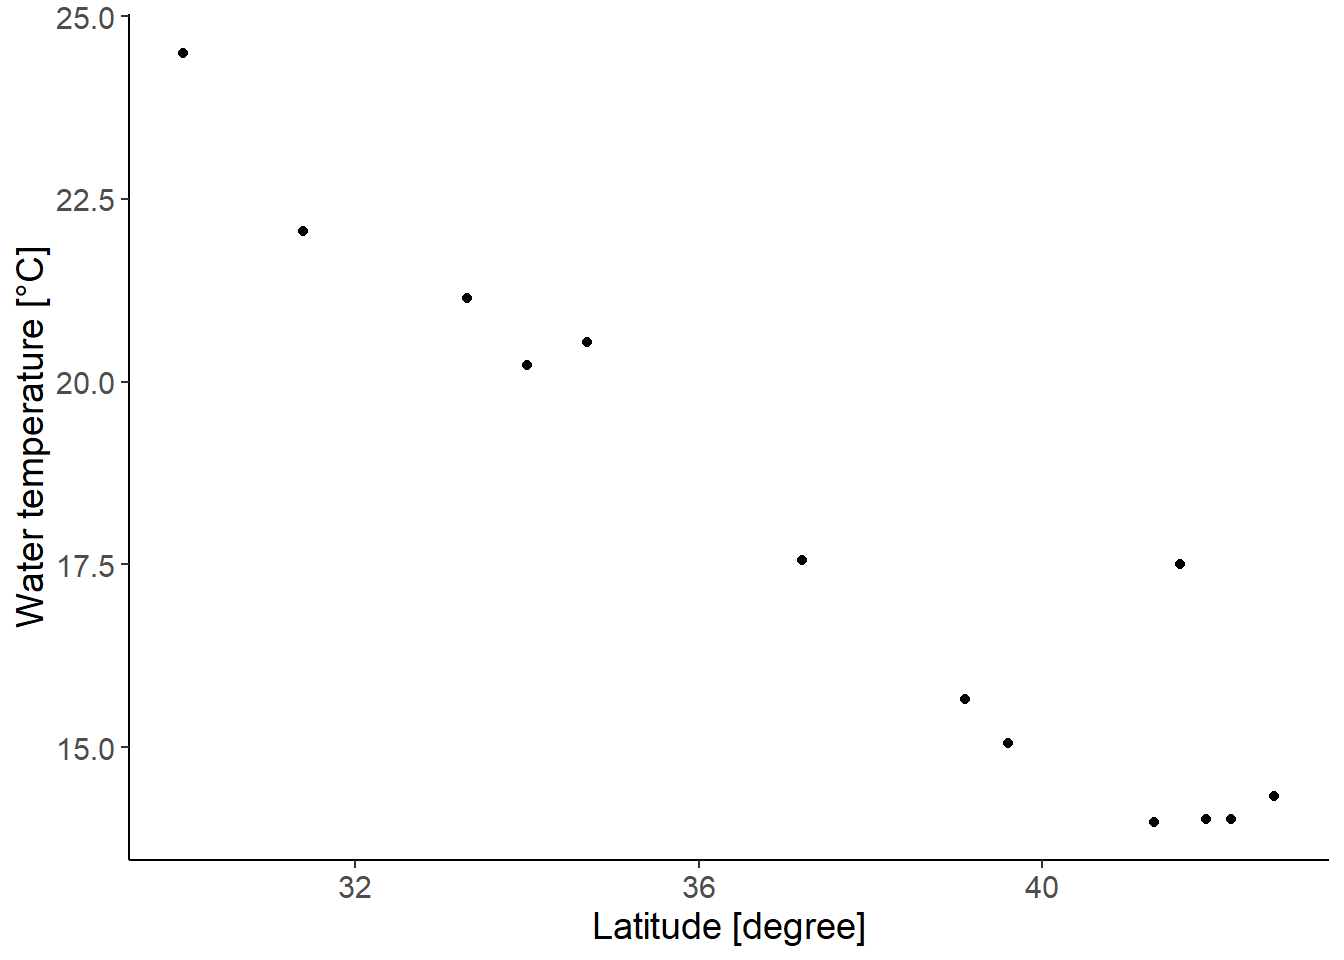
library(dplyr)library(readr)library(tidyr)library(ggplot2)library(ggfortify)## theme for ggplottheme_set(theme_classic())theme_update(text =element_text(size =14))## load data setdf_crabs <-read_csv("data/06_crab_size.csv")## plot latitude vs air temperatureggplot(df_crabs, aes(latitude, water_temp)) +geom_point() +labs(x ="Latitude [degree]", y ="Water temperature [°C]")
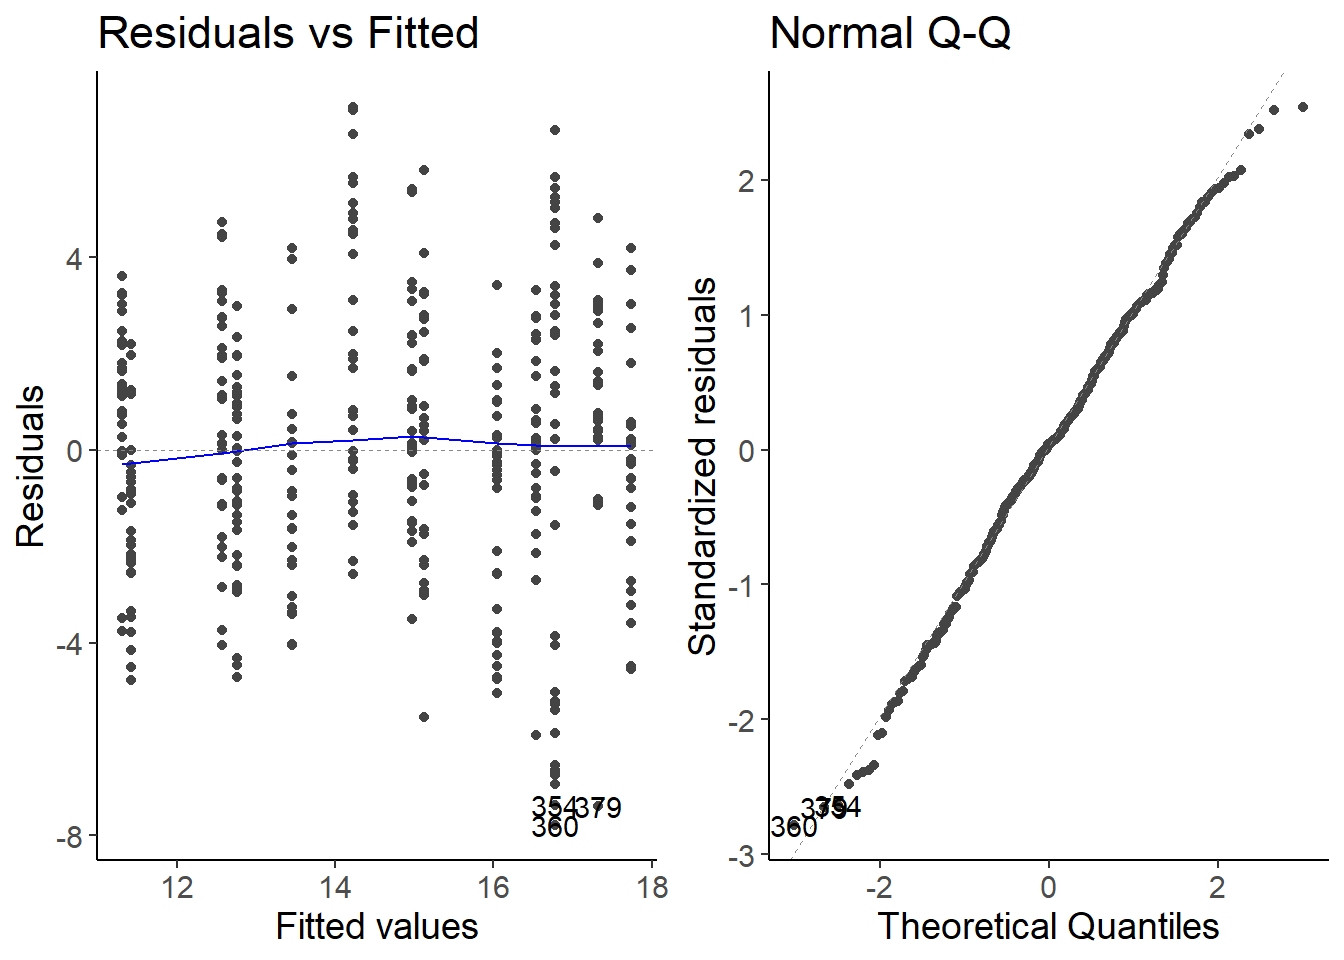
## fit linear modellm1 <-lm(size ~ latitude + water_temp, data = df_crabs)## check model assumptionsautoplot(lm1, which =1:2)
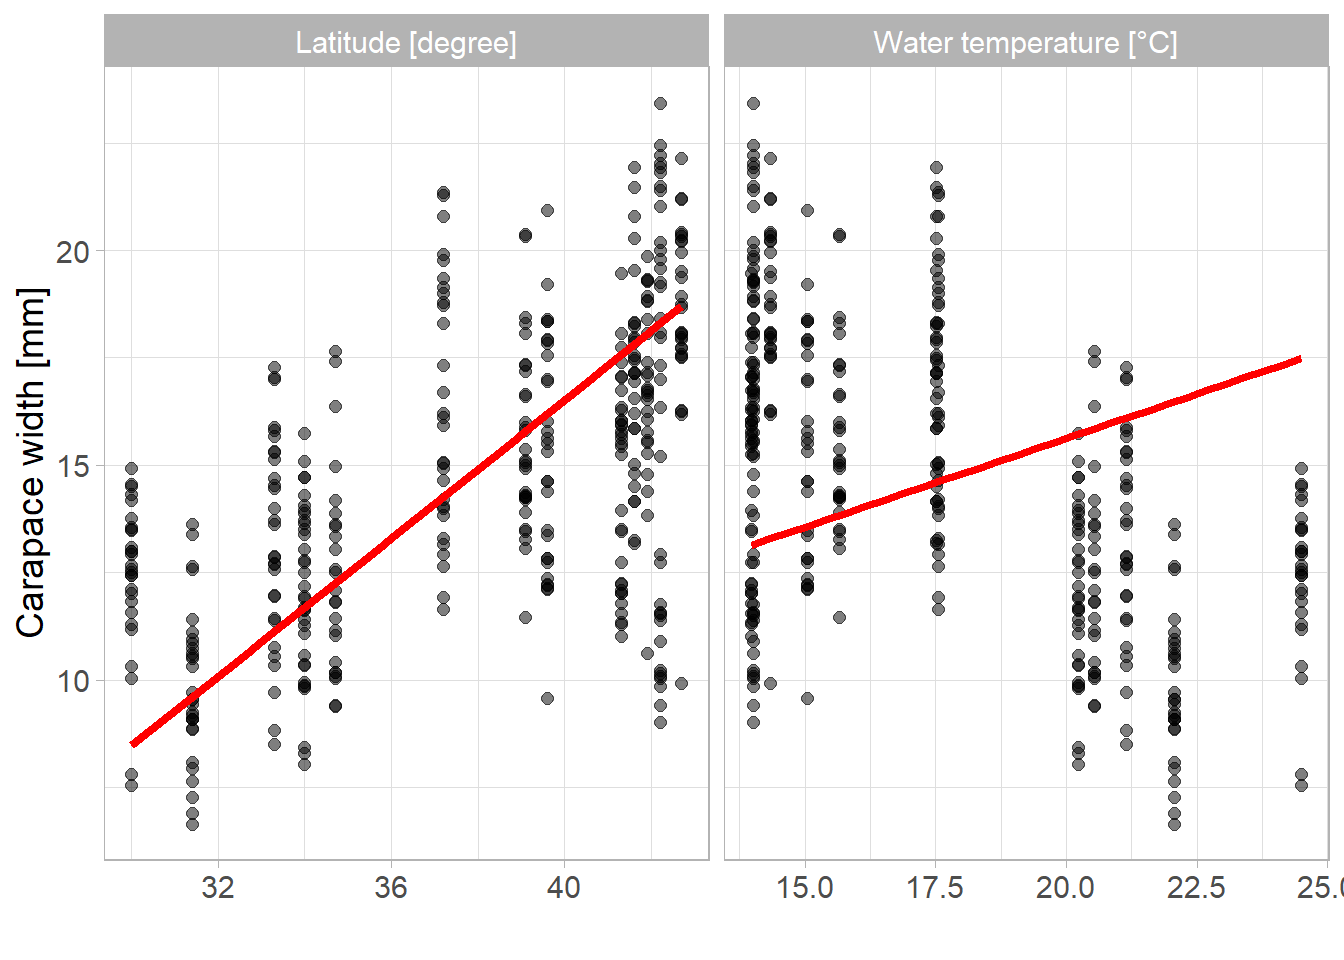
## make and plot marginal effects# create tibbles with predictionsdf_lat <-tibble(latitude =seq(min(df_crabs$latitude), max(df_crabs$latitude), length.out =30),water_temp =mean(df_crabs$water_temp)) %>%mutate(size =predict(lm1, newdata = .)) %>%select(-water_temp) %>%mutate(name ="Latitude [degree]") %>%rename(x = latitude)df_watertemp <-tibble(latitude =mean(df_crabs$latitude),water_temp =seq(min(df_crabs$water_temp), max(df_crabs$water_temp), length.out =30)) %>%mutate(size =predict(lm1, newdata = .)) %>%select(-latitude) %>%mutate(name ="Water temperature [°C]") %>%rename(x = water_temp)df_pred <-bind_rows(df_lat, df_watertemp) # bring original data into long data formatdf_plot <- df_crabs %>%select(size, latitude, water_temp) %>%pivot_longer(c(latitude, water_temp), values_to ="x") %>%mutate(name =factor(name, levels =c("latitude", "water_temp"),labels =c("Latitude [degree]", "Water temperature [°C]")))# plot marginal effectsggplot(df_pred, aes(x = x, y = size)) +geom_point(data = df_plot, size =2, alpha =0.5) +geom_line(color ="red", linewidth =1.5) +facet_wrap(~ name, scales ="free_x") +labs(x ="", y ="Carapace width [mm]") +theme_light() +theme(text =element_text(size =14))