Generalized Linear Models for count and proportion data
1 Lecture
2 Exercise 1
Revisit the example from the lecture on species richness depending on biomass and pH of a site in the dataset 08_species.csv.
In the lecture, the data and the model predictions were plotted on the scale of the response variable (see slide 25). Now, create a similar plot with data and predictions at the scale of the link function, or in other words at the scale of the linear predictor. That means the scaling of the y-axis has to be adjusted.
Discuss the pros and cons of the figure using the response-scale vs. the link-scale for the y axis.
For predictions on the link-scale use: predict(your_model, your_newdata, type = "link")
You also have to scale the data with an appropriate function. Which one? See slide 10!
You need to transform the data with the link-function, which is the log() function here.
An alternative solution is to keep data and predictions at the response scale and only use a log-scaled y-axis in the figure by adding + scale_y_log10() in the ggplot() call.
3 Exercise 2
In this example, we investigate the occurrence of Odonata larvae (dragonflies and damselflies) in water-filled bromeliads, which are epiphytic tropical plants. The data were adopted from Petermann et al. 2015 and is provided in the dataset 08_bromeliads.csv.
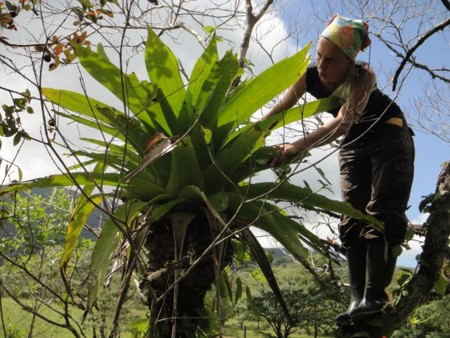
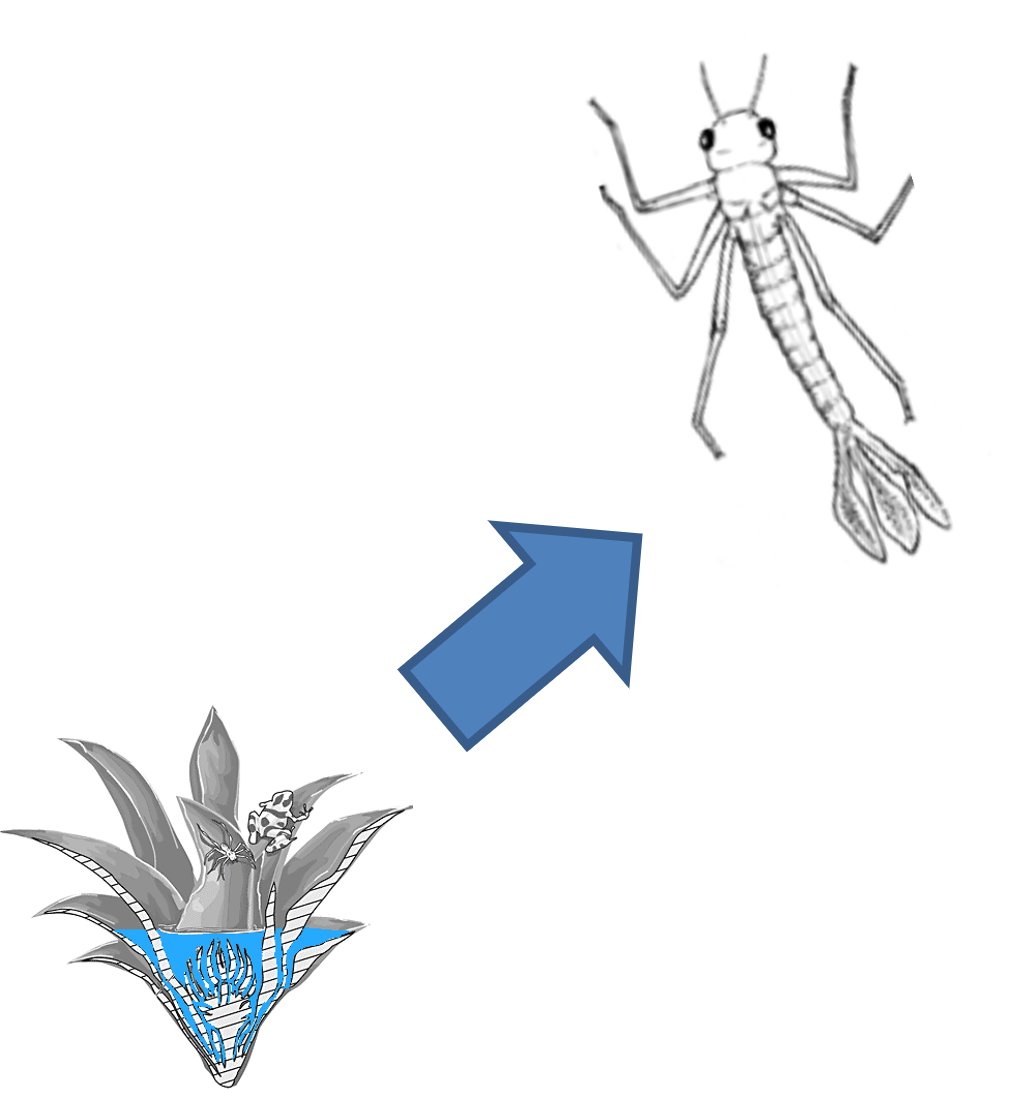
The main research question is: “How does bromeliad size (measured by volume) influence the presence or absence of Odonata larvae?
- Response variable:
Odonatepresence(0 - absent, 1 - present) - Explanatory variable:
logmaxvolume
- Plot the relationship between Odonata occurrence and bromeliad size!
- Which type of data do you have here? Which type of GLM do you need for the analysis?
- Fit a GLM with appropriate error distribution and link function!
- Test the effect of bromeliad volume on Odonata occurrence!
- Plot the data and the model predictions.
- Think about the question: “What exactly does the line with the model predictions show?”
3.1 Extra
- Fit, analyse and visualise a more complex model with
logmaxvolumeandsiteas predictor variables! - Does the effect of bromeliad size on Odonata occurrence differ between sites?
- What might to be the statistical problem in answering this question?