Solution to the hypothesis testing exercise with the bacteria dataset
1 Script with output
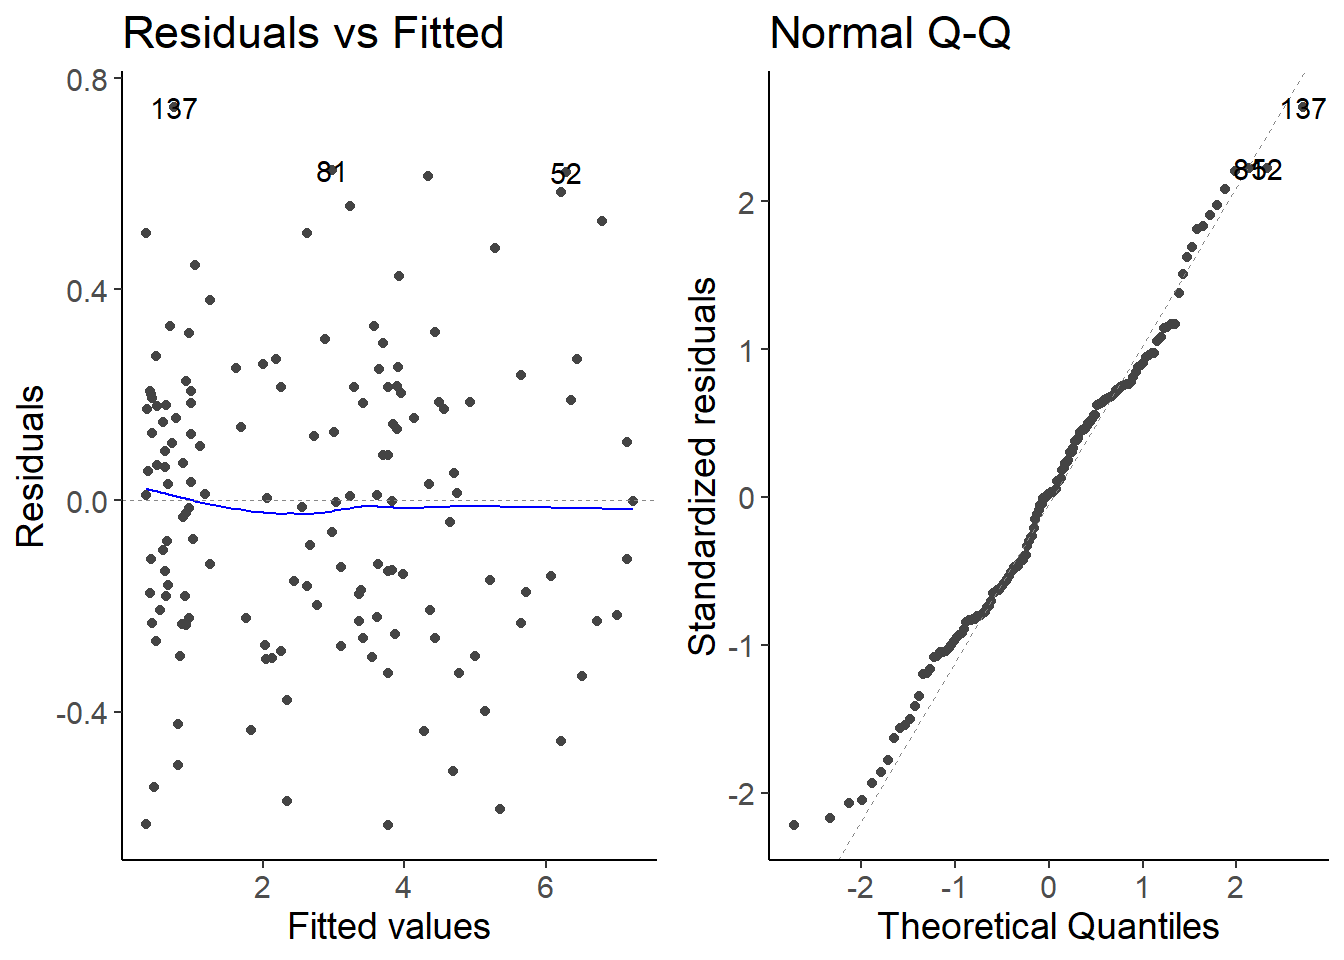
library(dplyr)library(readr)library(ggplot2)library(ggfortify)## theme for ggplottheme_set(theme_classic())theme_update(text =element_text(size =14))df_bacteria <-read_csv("data/06_bacteria.csv")## fit model with interactionlm_bacteria <-lm(density ~ species * temperature, data = df_bacteria)## check assumptionsautoplot(lm_bacteria, which =1:2)
## hypothesis testingdrop1(lm_bacteria, test ="F")
Single term deletions

Model:
density ~ species * temperature
                    Df Sum of Sq    RSS     AIC F value    Pr(>F)
<none>                           11.753 -369.98
species:temperature  2    78.711 90.464  -67.85  482.18 < 2.2e-16 ***
---
Signif. codes:  0 '***' 0.001 '**' 0.01 '*' 0.05 '.' 0.1 ' ' 1
## to get the coefficient valuessummary(lm_bacteria)
Call:
lm(formula = density ~ species * temperature, data = df_bacteria)

Residuals:
     Min       1Q   Median       3Q      Max
-0.61411 -0.21434  0.00655  0.18925  0.74622

Coefficients:
                             Estimate Std. Error t value Pr(>|t|)
(Intercept)                  -5.28220    0.44964 -11.748  < 2e-16 ***
speciesspecies2             -10.19381    0.61590 -16.551  < 2e-16 ***
speciesspecies3               3.90402    0.59373   6.575 8.34e-10 ***
temperature                   0.31533    0.01620  19.461  < 2e-16 ***
speciesspecies2:temperature   0.40295    0.02225  18.109  < 2e-16 ***
speciesspecies3:temperature  -0.24009    0.02151 -11.161  < 2e-16 ***
---
Signif. codes:  0 '***' 0.001 '**' 0.01 '*' 0.05 '.' 0.1 ' ' 1

Residual standard error: 0.2857 on 144 degrees of freedom
Multiple R-squared:  0.9797,    Adjusted R-squared:  0.979
F-statistic:  1389 on 5 and 144 DF,  p-value: < 2.2e-16
2 Explanation of the output
We tested whether we can reject the null hypothesis that the effect (slope) of the temperature is not dependent on the bacteria species. We come to the conclusion that we can reject the null hypothesis (F = 482.2, df = 2, p < 0.00001).