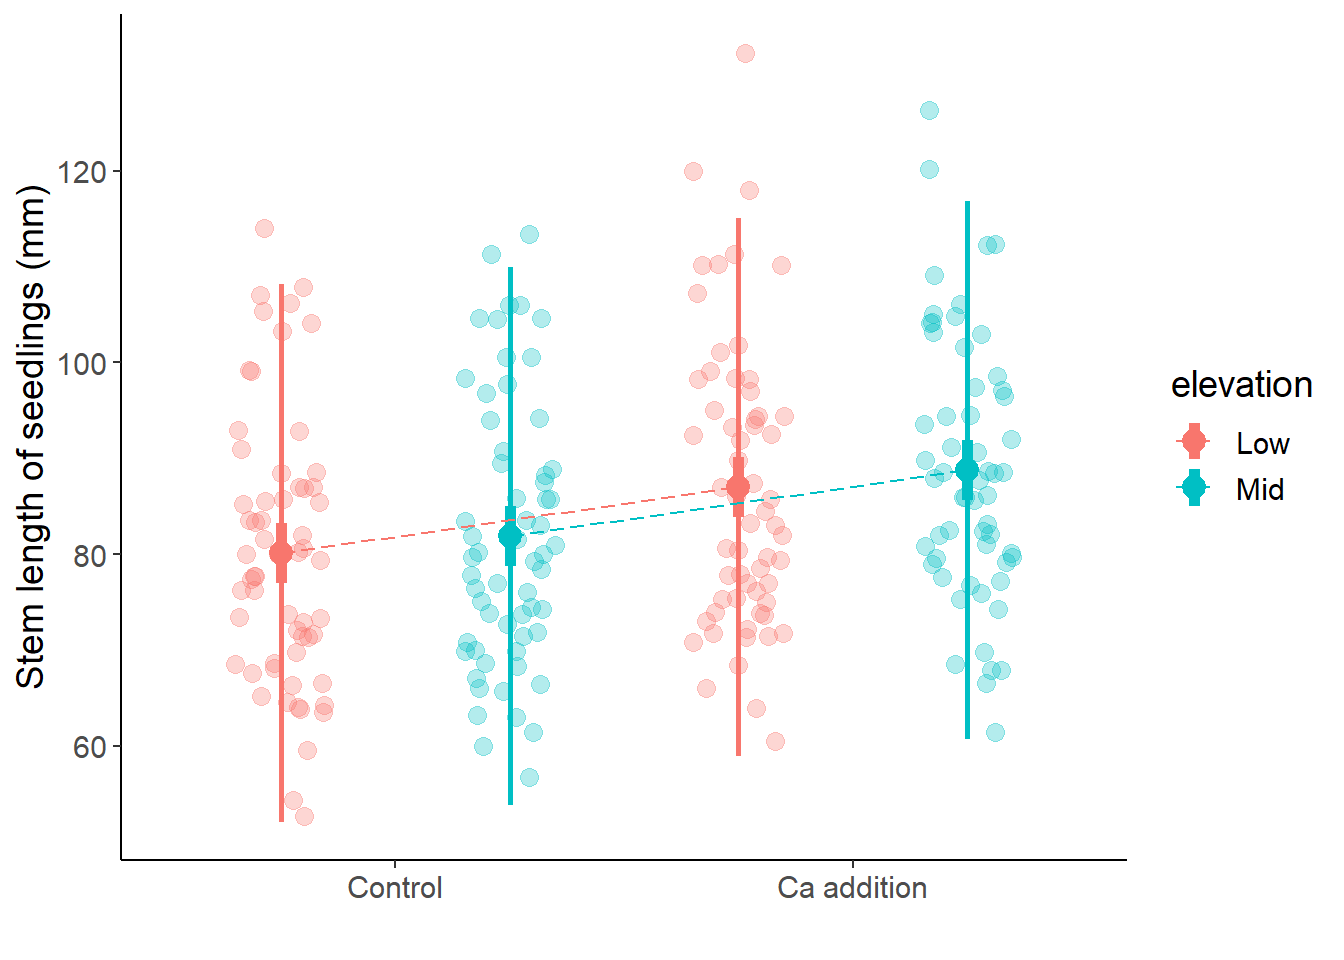
The effect of calcium addition on stem length of sugar maple seedlings was tested in a factorial experiment with two levels of calcium addition (control and calcium addition) and two levels of elevation (low and mid). Calcium addition has a significant effect on stem length (F = 14.28, df = 1, p = 0.0002). The effect size is 6.9 with a standard error of 1.83. This means that the mean stem length of the seedlings in the experimental conditions increased by 6.9 mm when additional calcium was applied.
3 Solution for copy-pasting
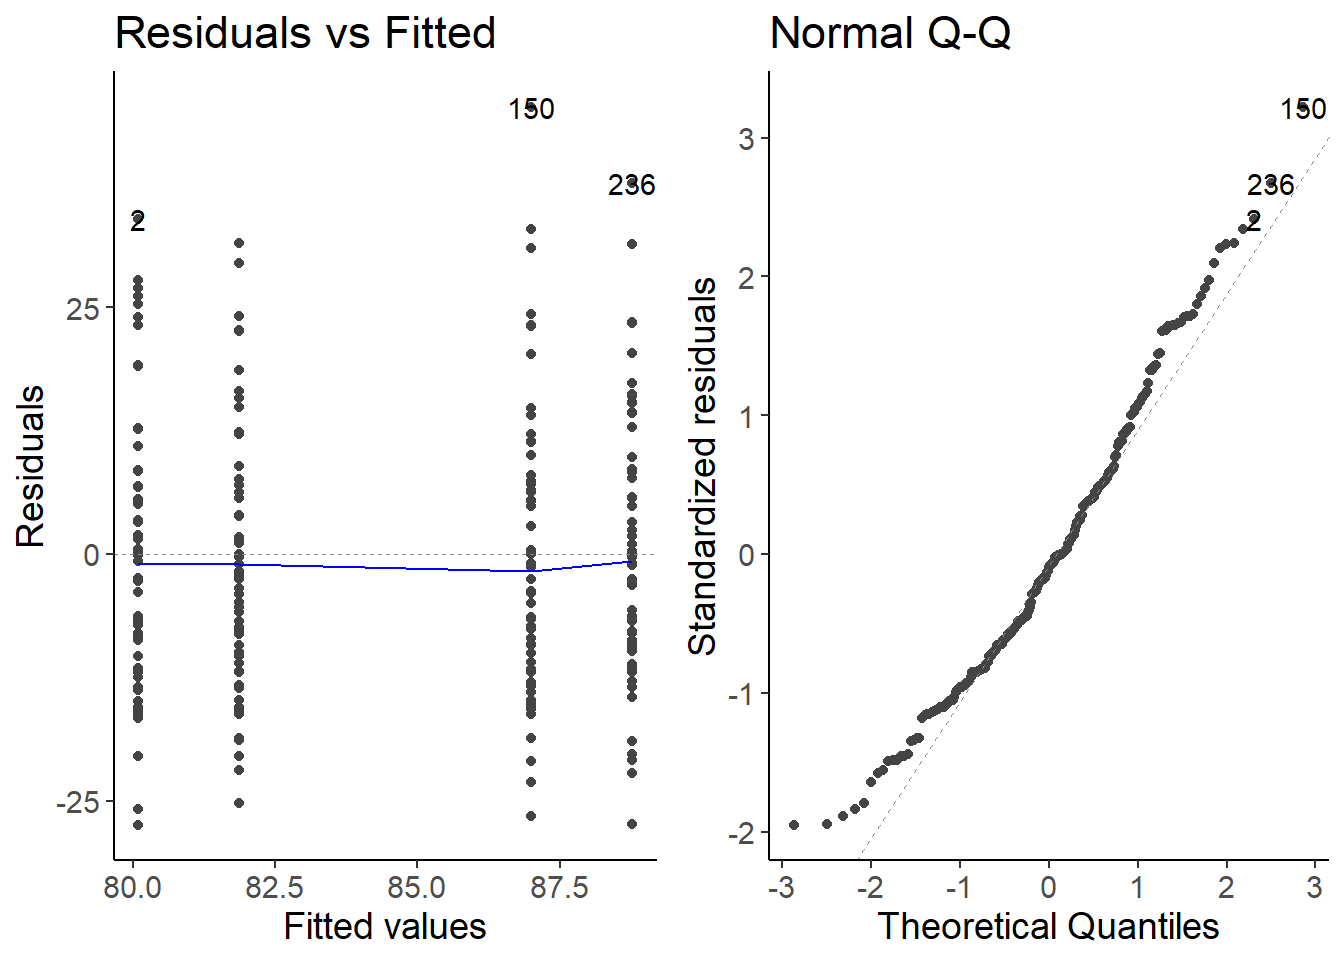
## load packageslibrary(dplyr)library(readr)library(tidyr)library(ggplot2)library(ggfortify)## theme for ggplottheme_set(theme_classic())theme_update(text =element_text(size =14))## Load datasetdf_maples_prep <-read_csv("data/06_maples.csv")## Apply transformationdf_maples <- df_maples_prep %>%mutate(calcium_addition =factor(watershed, levels =c("Reference", "W1"),labels =c("Control", "Ca addition"))) %>%select(stem_length, elevation, calcium_addition)## Fit linear modellm_maples <-lm(stem_length ~ elevation + calcium_addition, data = df_maples)## Check assumptionautoplot(lm_maples, which =1:2)## Hypothesis testing (LRT = F-test)drop1(lm_maples, test ="F")## Check effect size and standard errorsummary(lm_maples)## Bonus: add line in plotdf_maples_pred <-expand_grid(elevation =c("Low", "Mid"),calcium_addition =c("Control", "Ca addition")) %>%bind_cols(predict(lm_maples, newdata = ., interval ="confidence")) %>%rename(conf_low = lwr, conf_up = upr) %>%select(-fit) %>%bind_cols(predict(lm_maples, newdata = ., interval ="prediction")) %>%rename(pred_low = lwr, pred_up = upr) ggplot(df_maples, aes(calcium_addition, stem_length, color = elevation)) +geom_point(size =3, alpha =0.3,position =position_jitterdodge(dodge.width =1, jitter.width =0.2, jitter.height =0.0)) +geom_pointrange(aes(y = fit, ymin = pred_low, ymax = pred_up),data = df_maples_pred,position =position_dodge(width =1),linewidth =1, size =0) +geom_pointrange(aes(y = fit, ymin = conf_low, ymax = conf_up),data = df_maples_pred,position =position_dodge(width =1),linewidth =2, size =0.8) +geom_line(aes(y = fit, group = elevation), data = df_maples_pred, position =position_dodge(width =1),linetype ="longdash") +labs(x ="", y ="Stem length of seedlings (mm)")