Solution for calculating the likelihood for penguin dataset
1 Solution with output
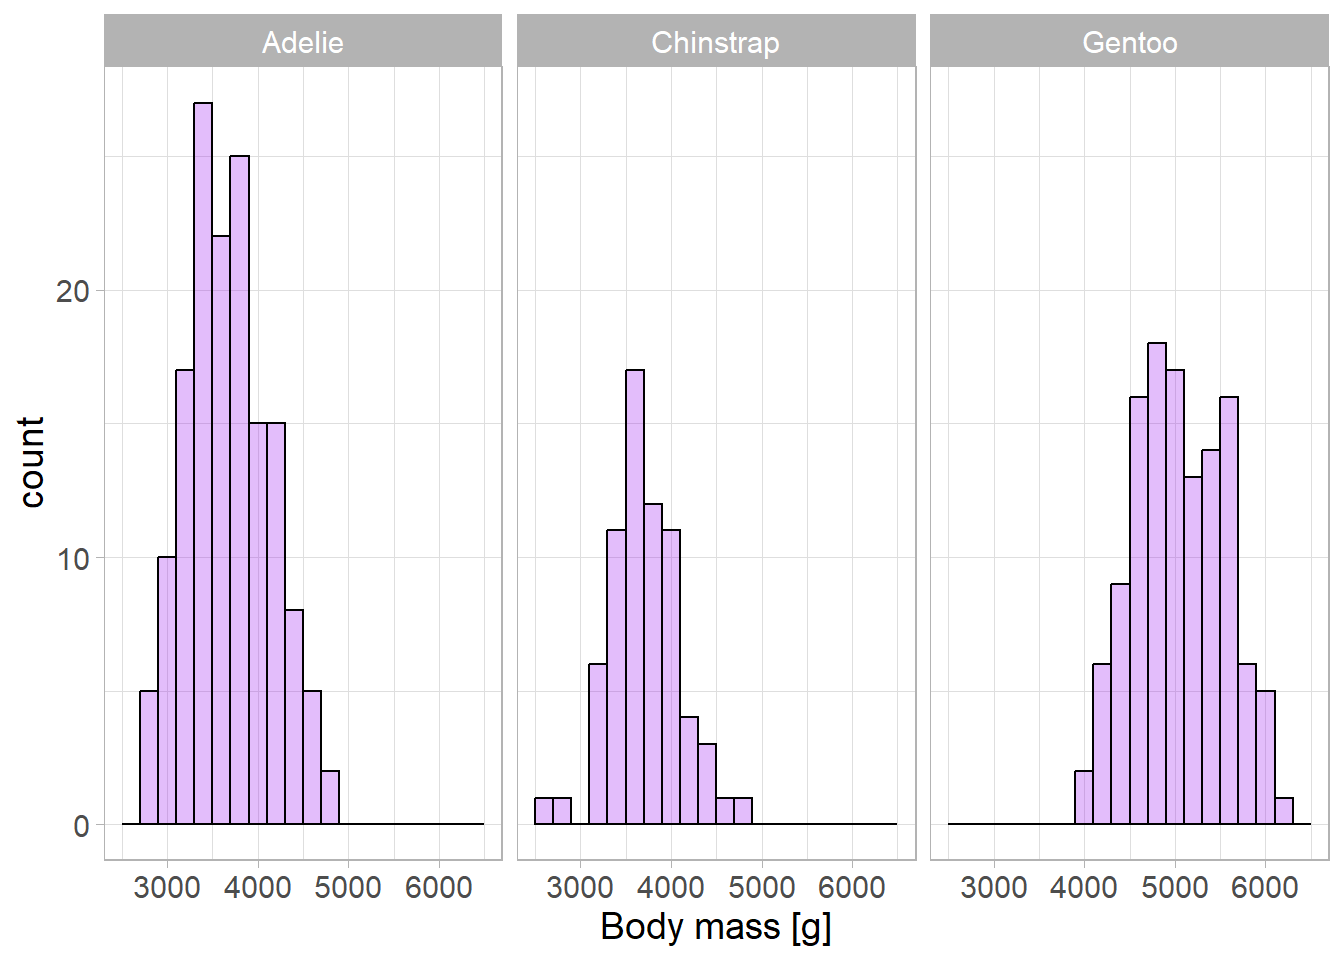
library(dplyr)library(readr)library(ggplot2)theme_set(theme_classic())theme_update(text =element_text(size =14))df_penguins <-read_csv("data/05_penguins.csv") ggplot(df_penguins, aes(body_mass_g)) +geom_histogram(breaks =seq(2500, 6500, 200), col ="black", fill ="purple", alpha =0.3) +facet_wrap(~species, nrow =1) +theme_light() +theme(text =element_text(size =14)) +labs(x ="Body mass [g]")
## Calculate the likelihood for Adelie penguins for N(4000, 500)df_adelie <- df_penguins %>%filter(species =="Adelie"&!is.na(body_mass_g))adelie_bodymass <-pull(df_adelie, body_mass_g)sum(dnorm(adelie_bodymass, mean =4000, sd =500, log =TRUE))
[1] -1167.311
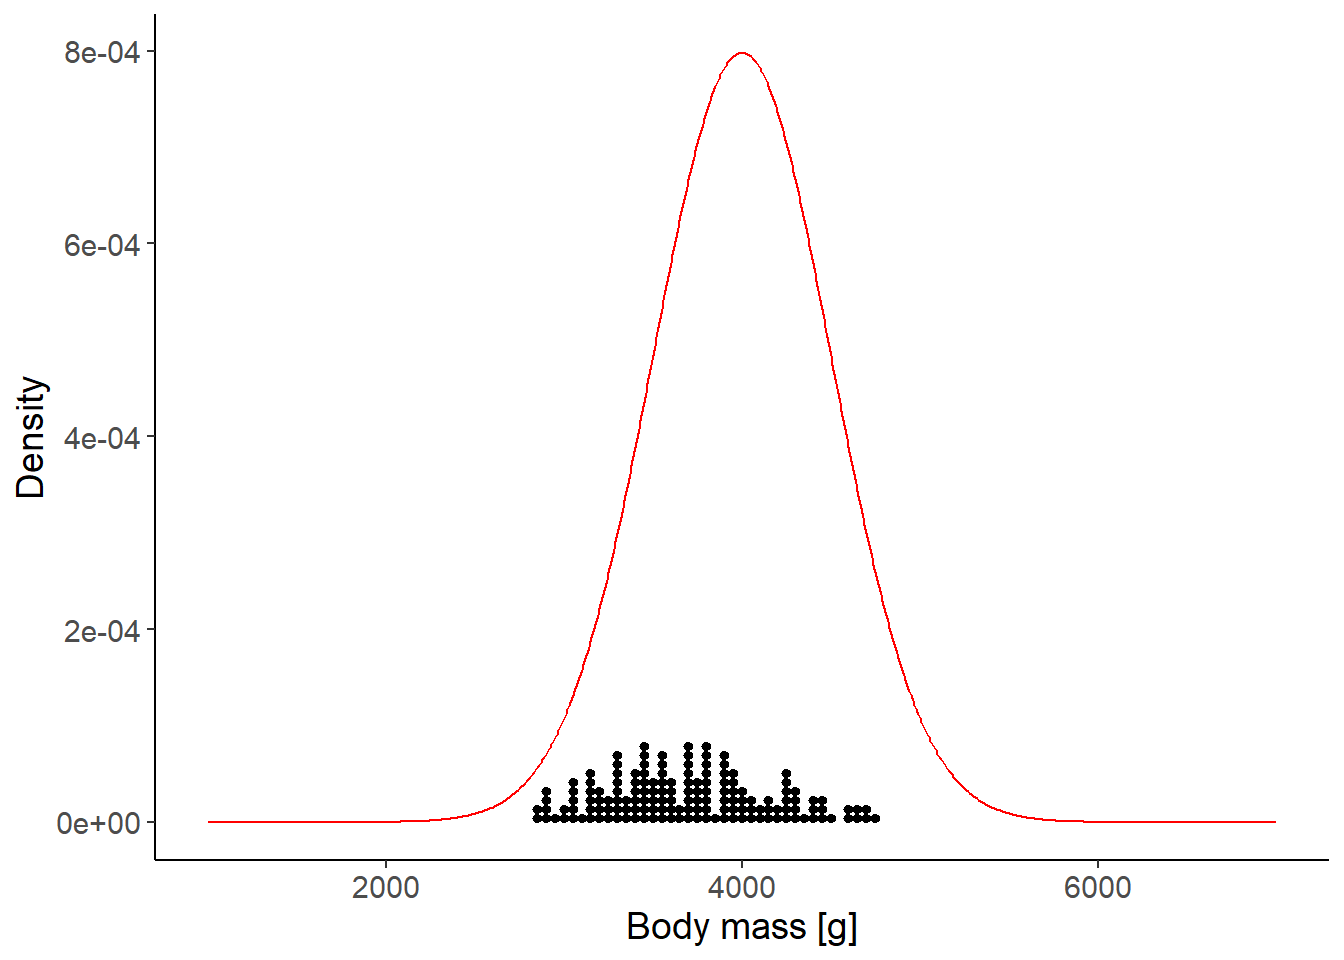
df_dens <-tibble(body_mass_g =seq(1000, 7000, 10),y =dnorm(body_mass_g, mean =4000, sd =500))## Plot the density and the dataggplot(df_adelie, aes(x = body_mass_g)) +geom_dotplot(method ="histodot", binwidth =50) +geom_line(data = df_dens, aes(x = body_mass_g, y = y), col ="red") +ylim(0, max(df_dens$y)) +labs(x ="Body mass [g]", y ="Density")
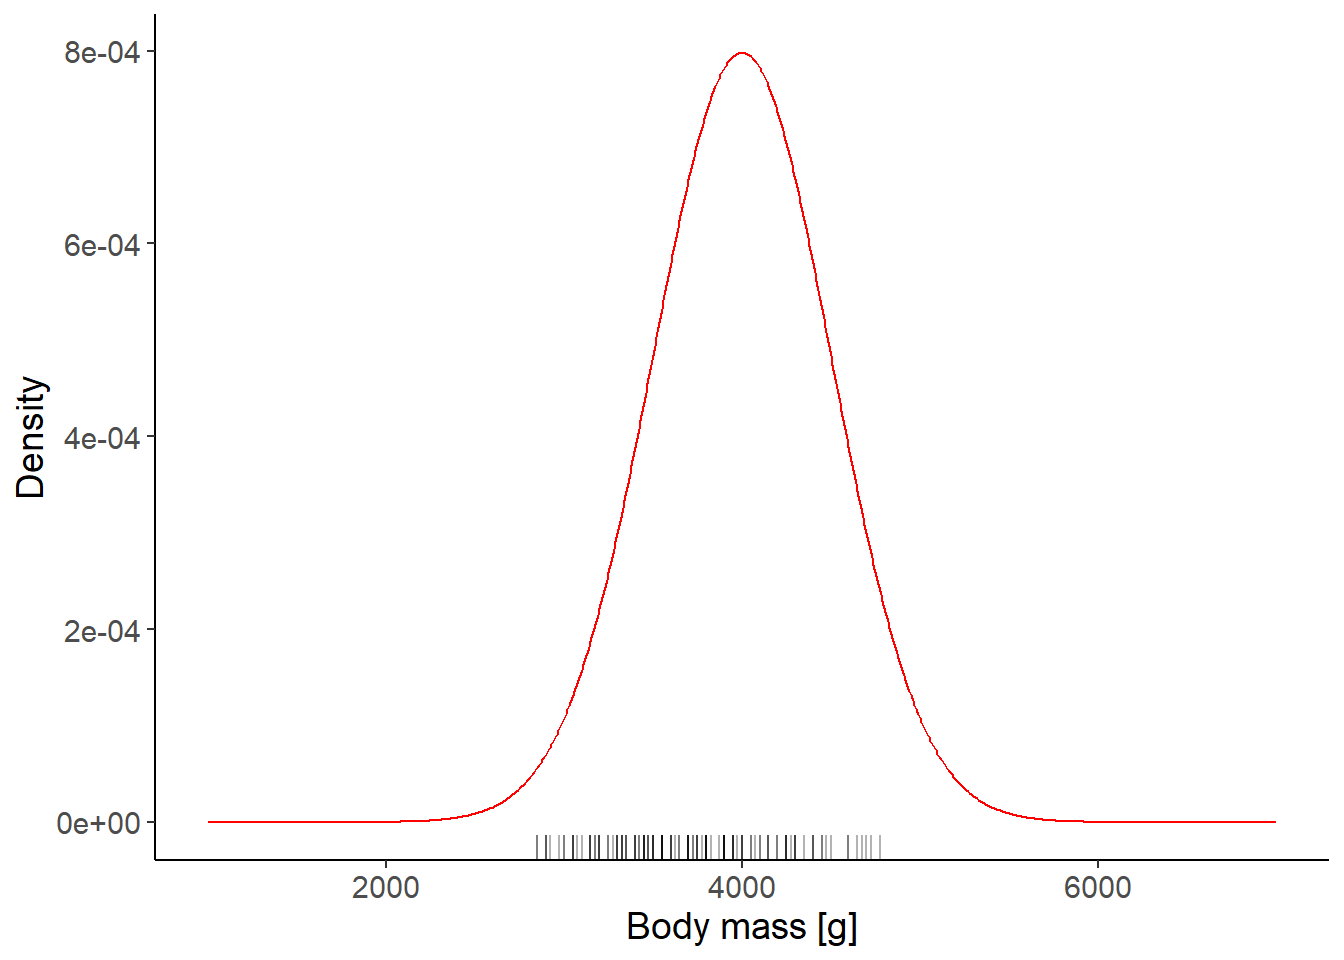
ggplot(df_adelie, aes(x = body_mass_g)) +geom_rug(alpha =0.3) +geom_line(data = df_dens, aes(y = y), col ="red") +labs(x ="Body mass [g]", y ="Density")
## Try out different values for the mean and sdsum(dnorm(adelie_bodymass, mean =4000, sd =500, log =TRUE))
[1] -1167.311
sum(dnorm(adelie_bodymass, mean =3500, sd =500, log =TRUE))
[1] -1152.411
sum(dnorm(adelie_bodymass, mean =3500, sd =200, log =TRUE))
[1] -1409.087
sum(dnorm(adelie_bodymass, mean =3500, sd =700, log =TRUE))
[1] -1166.363
## Maximum likelihood estimationmle_mean <-mean(adelie_bodymass)mle_sd <-sd(adelie_bodymass)sum(dnorm(adelie_bodymass, mean = mle_mean, sd = mle_sd, log =TRUE))