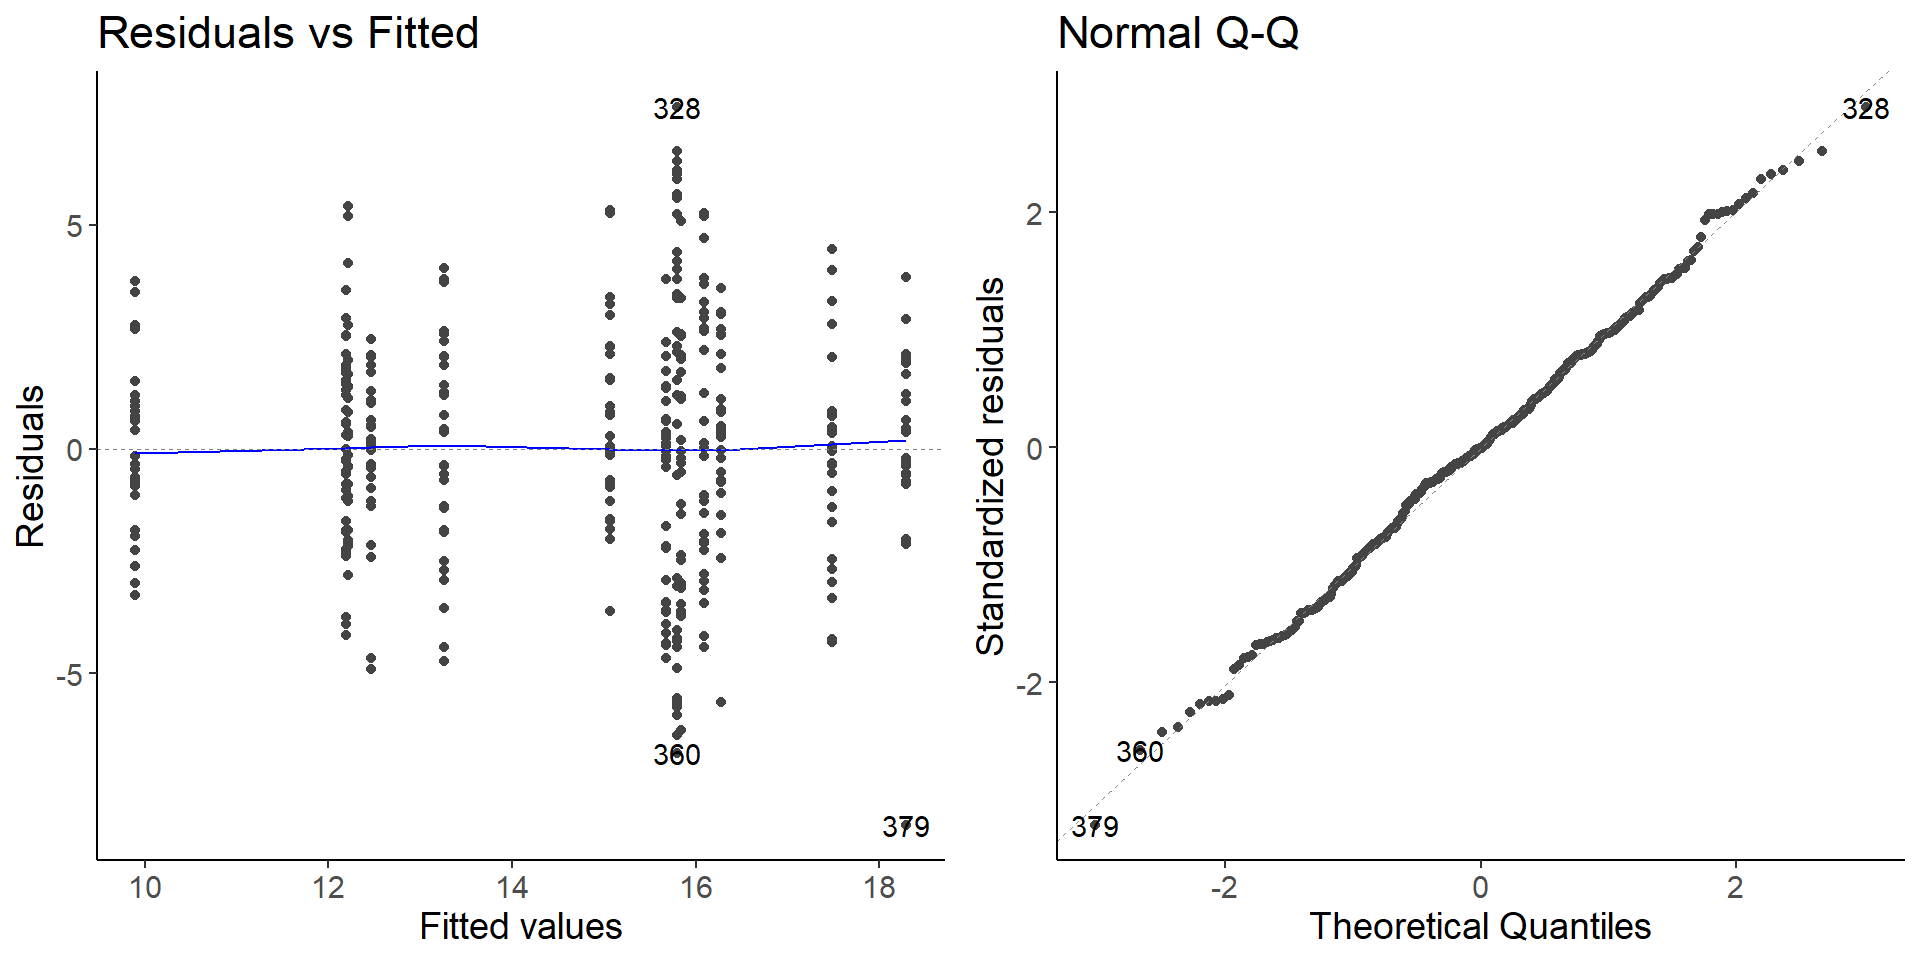
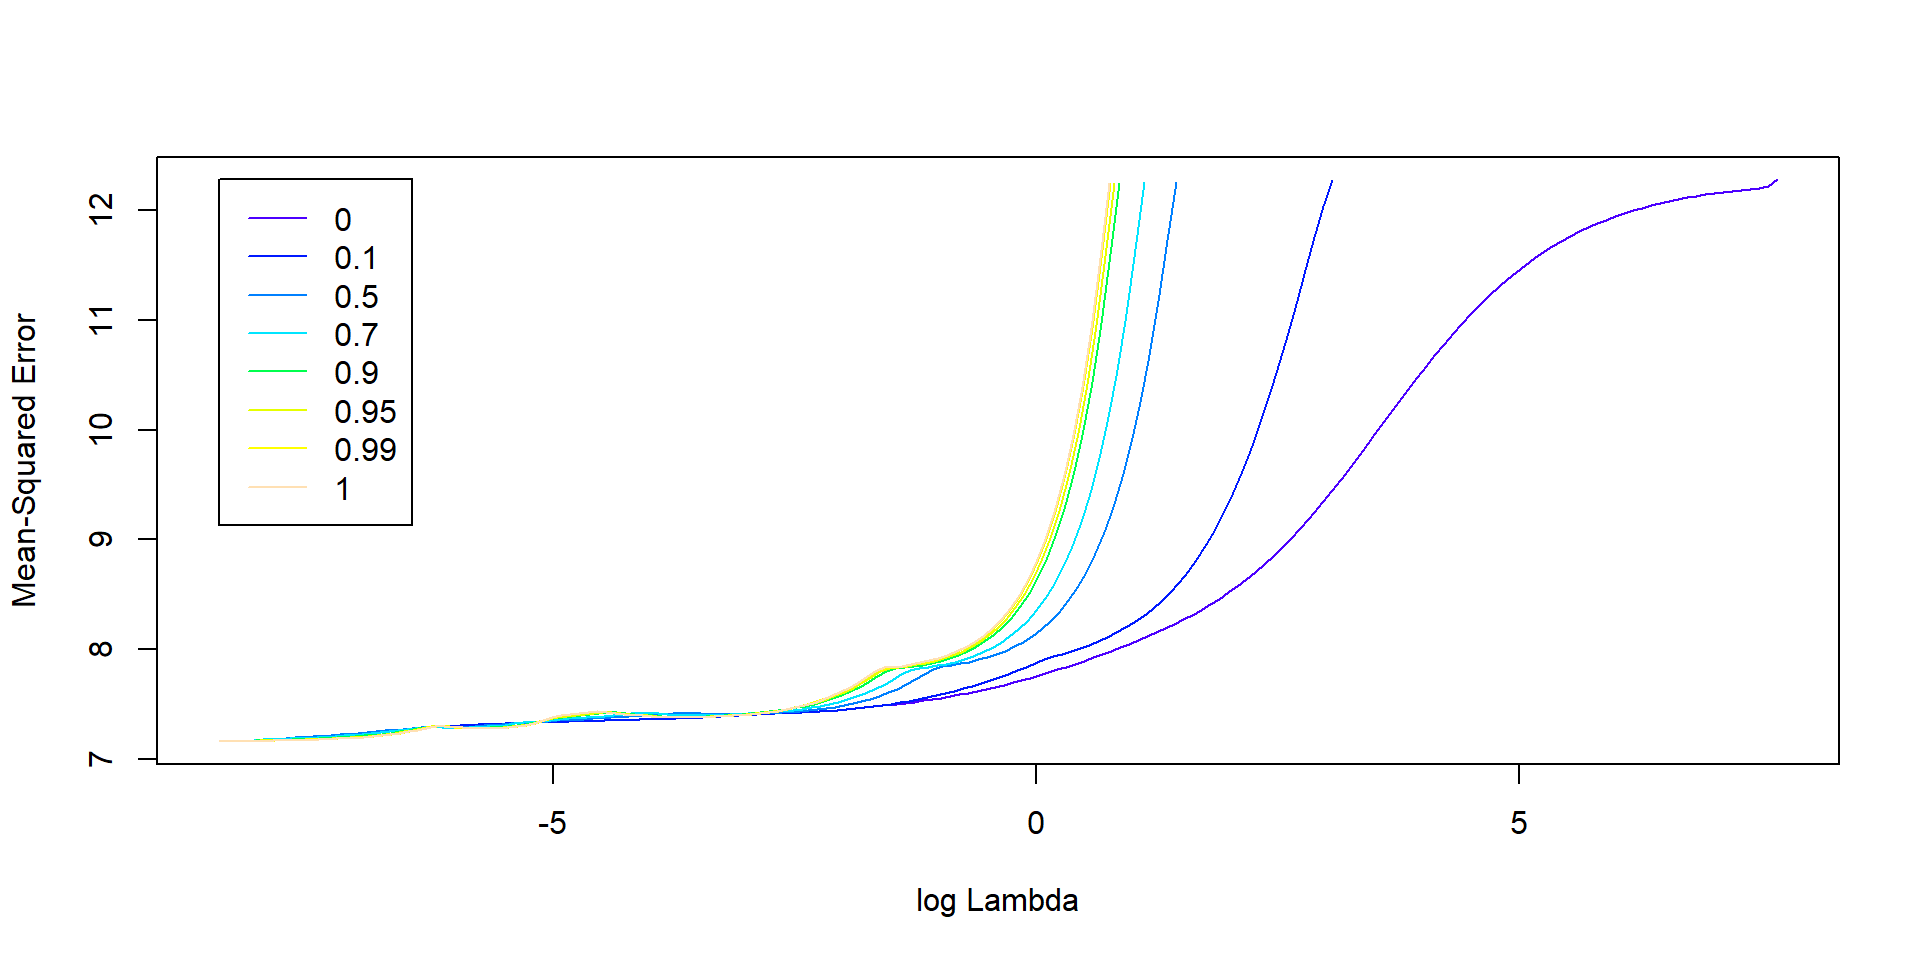
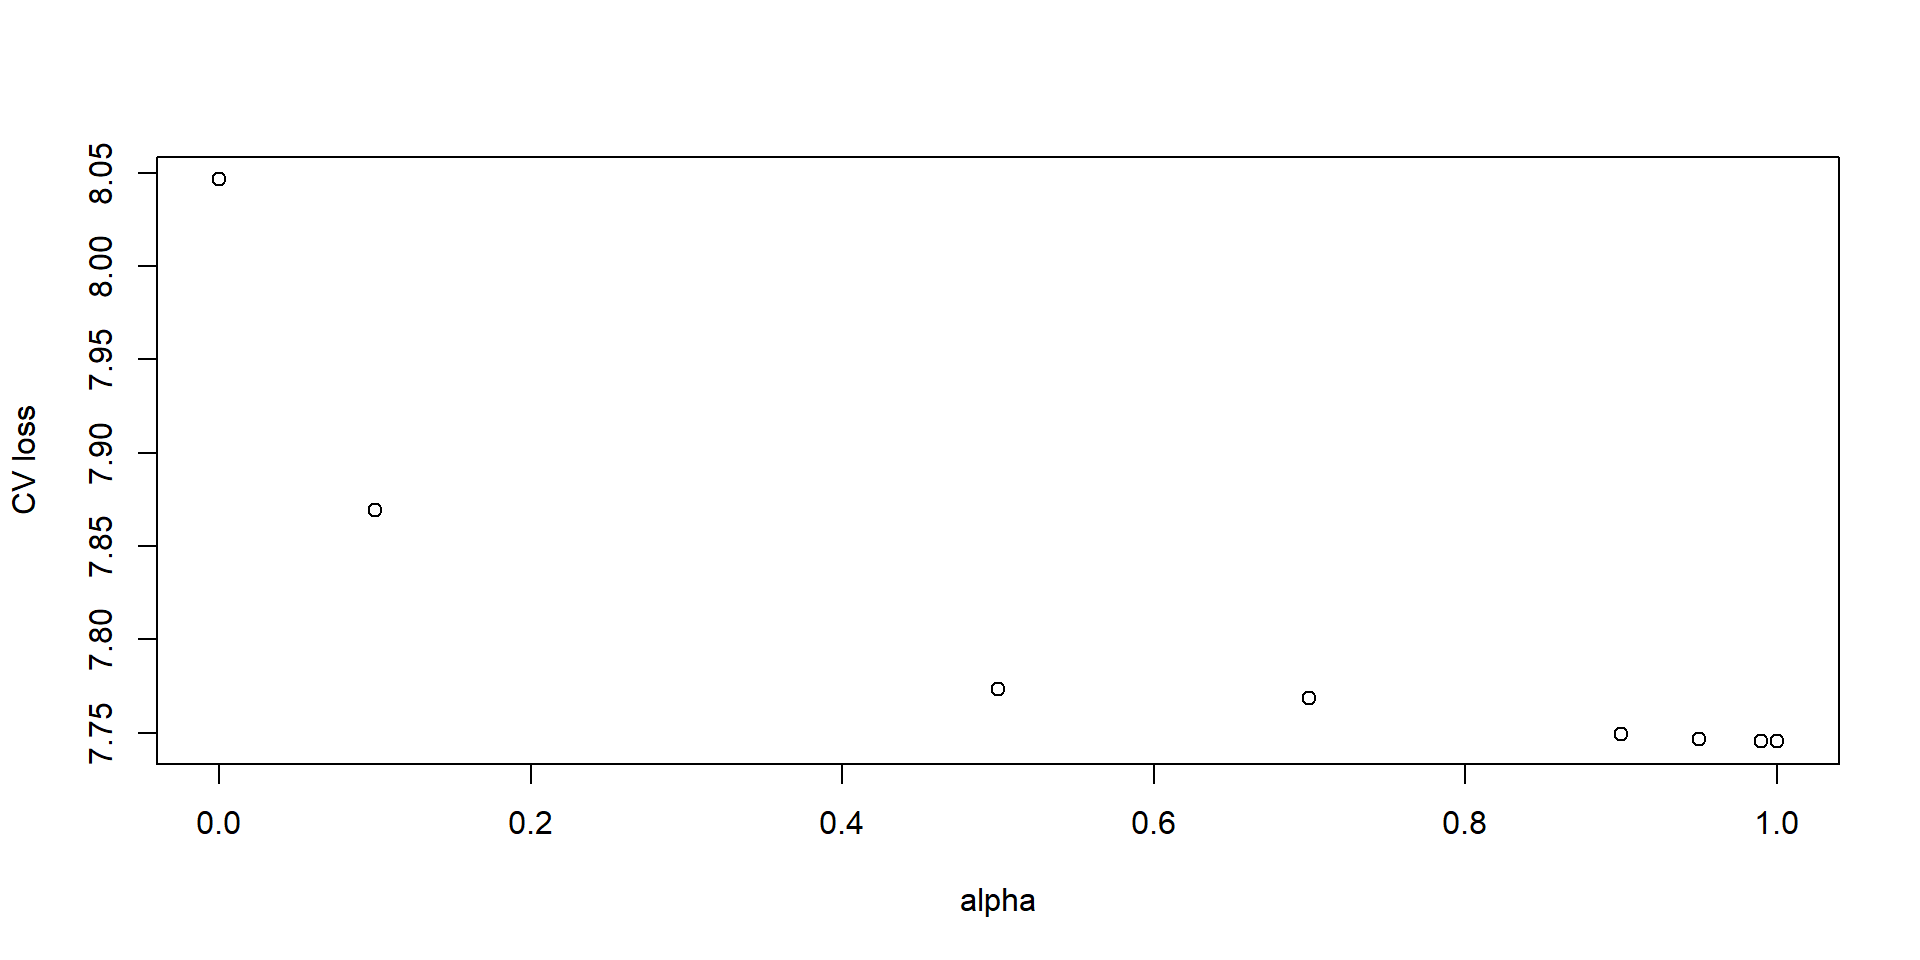
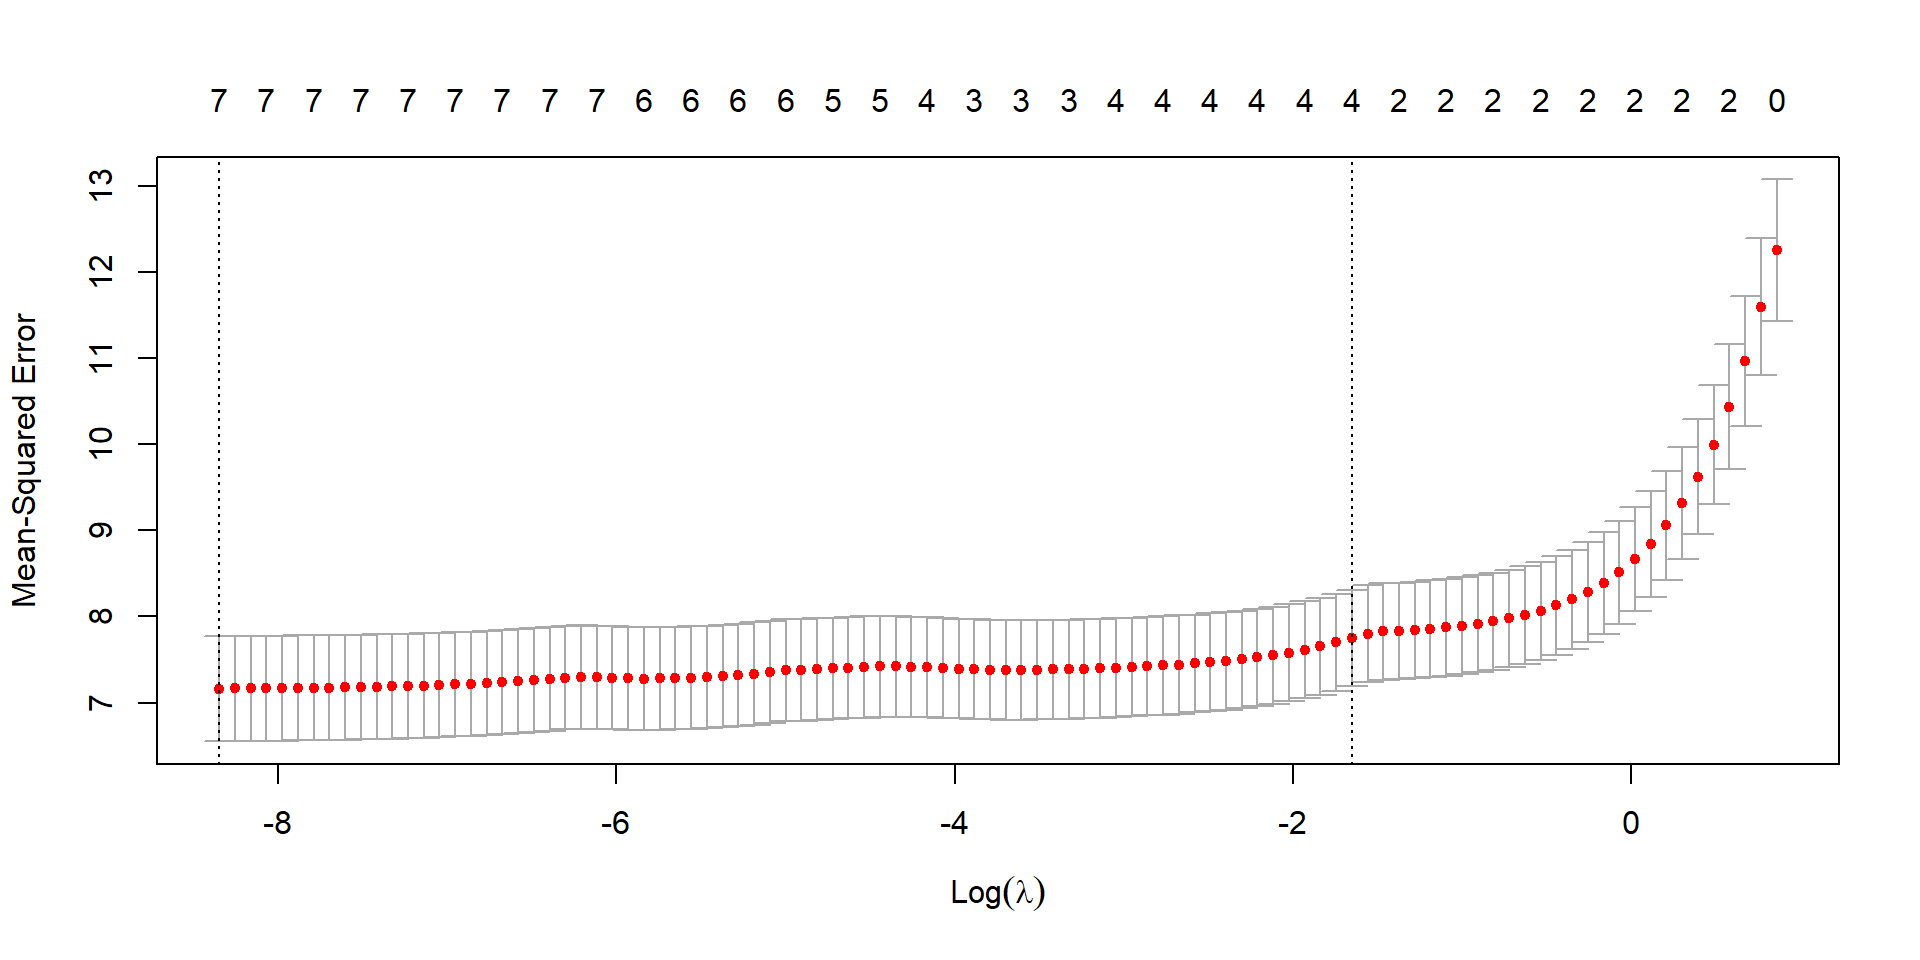
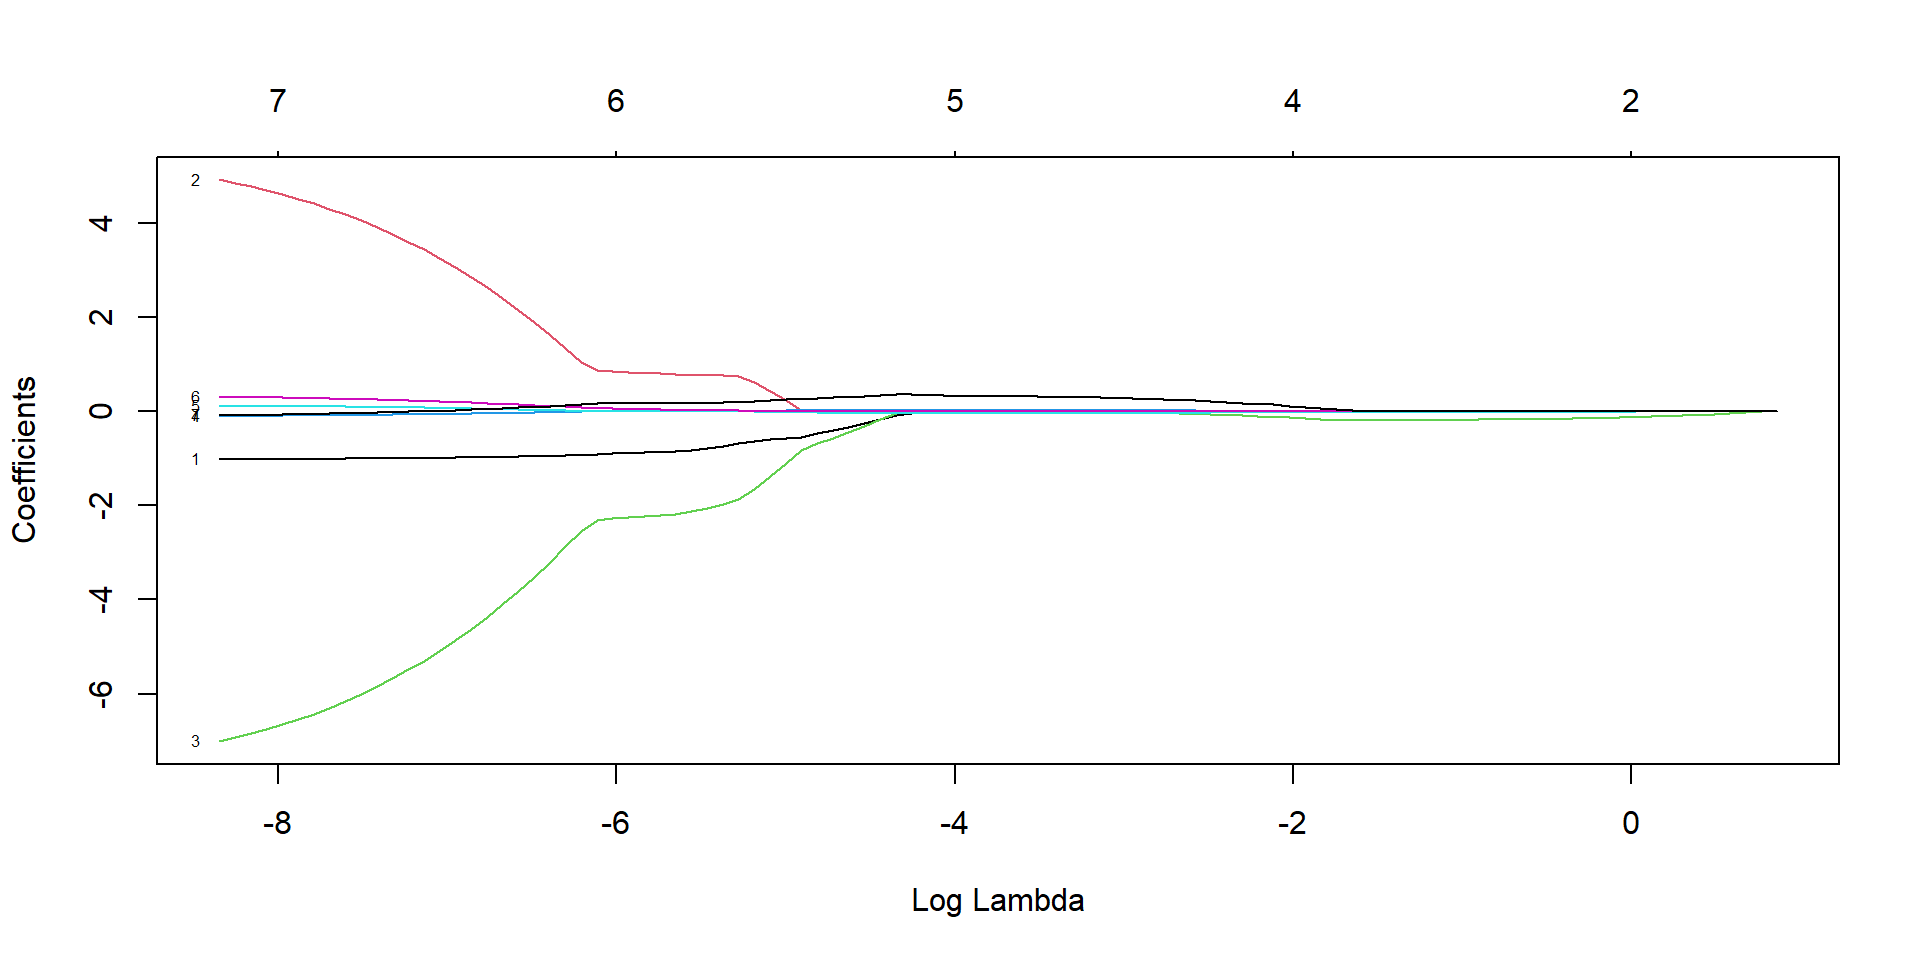
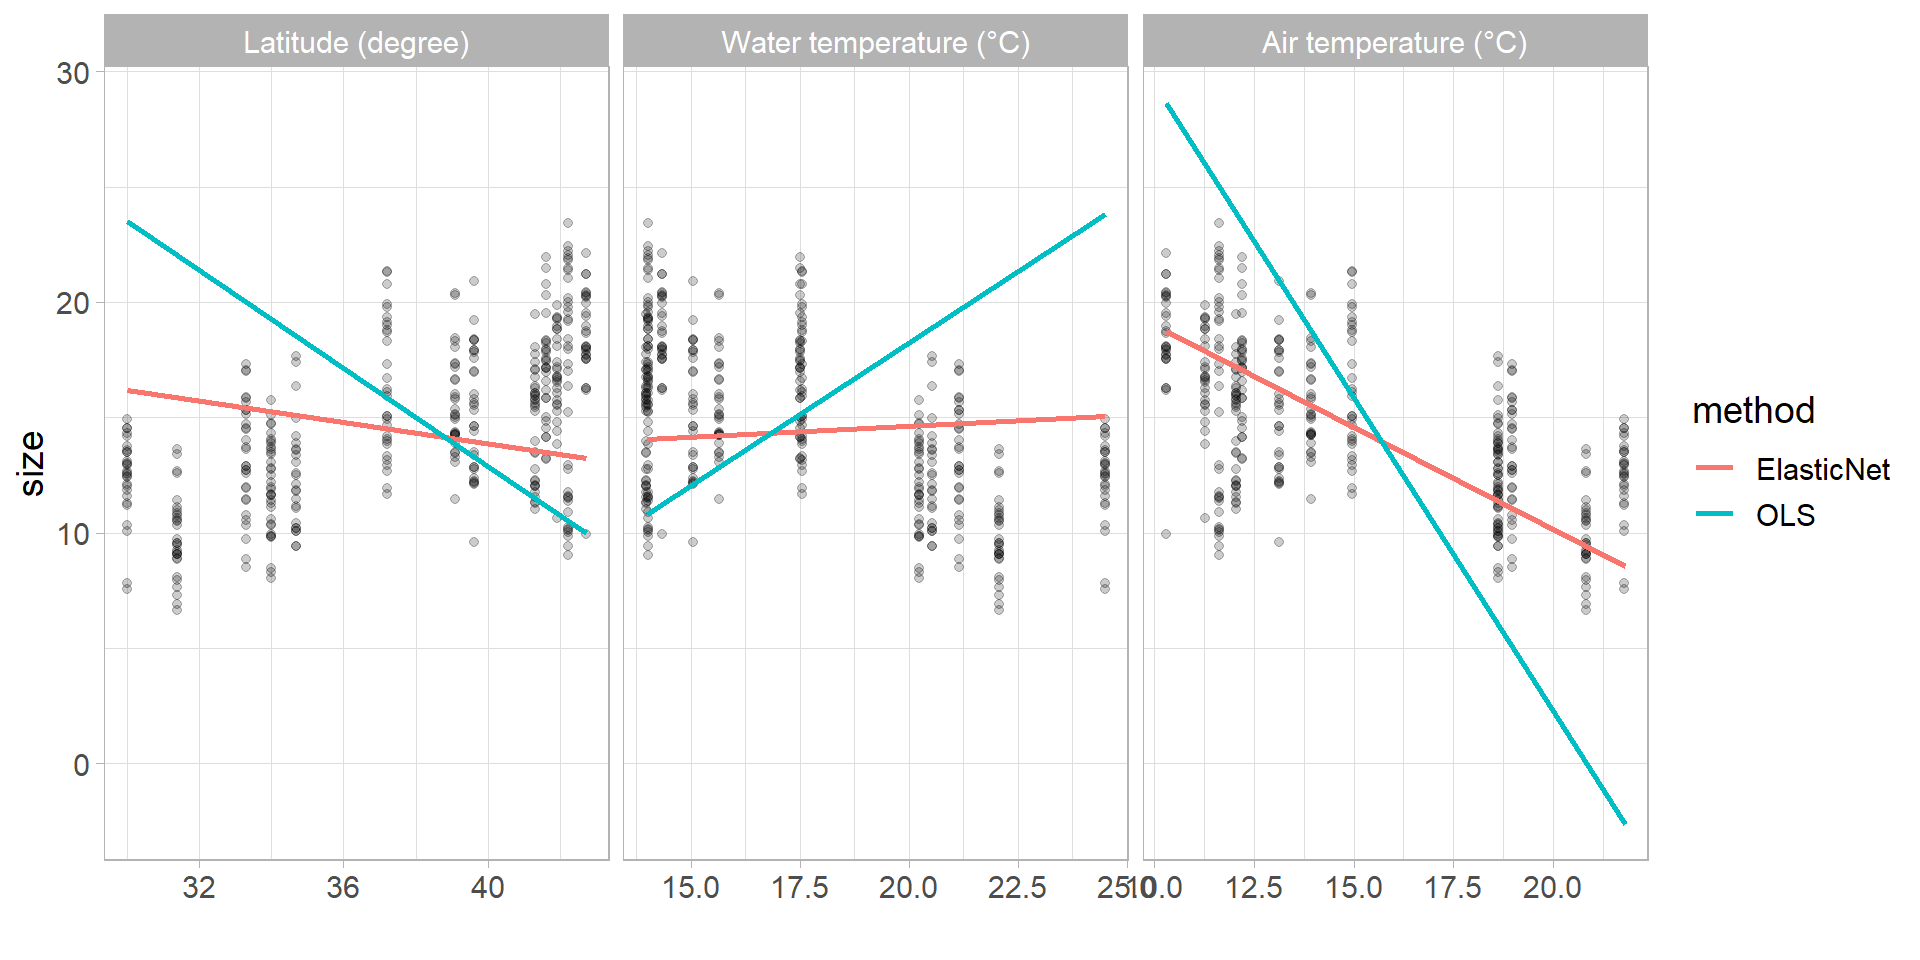
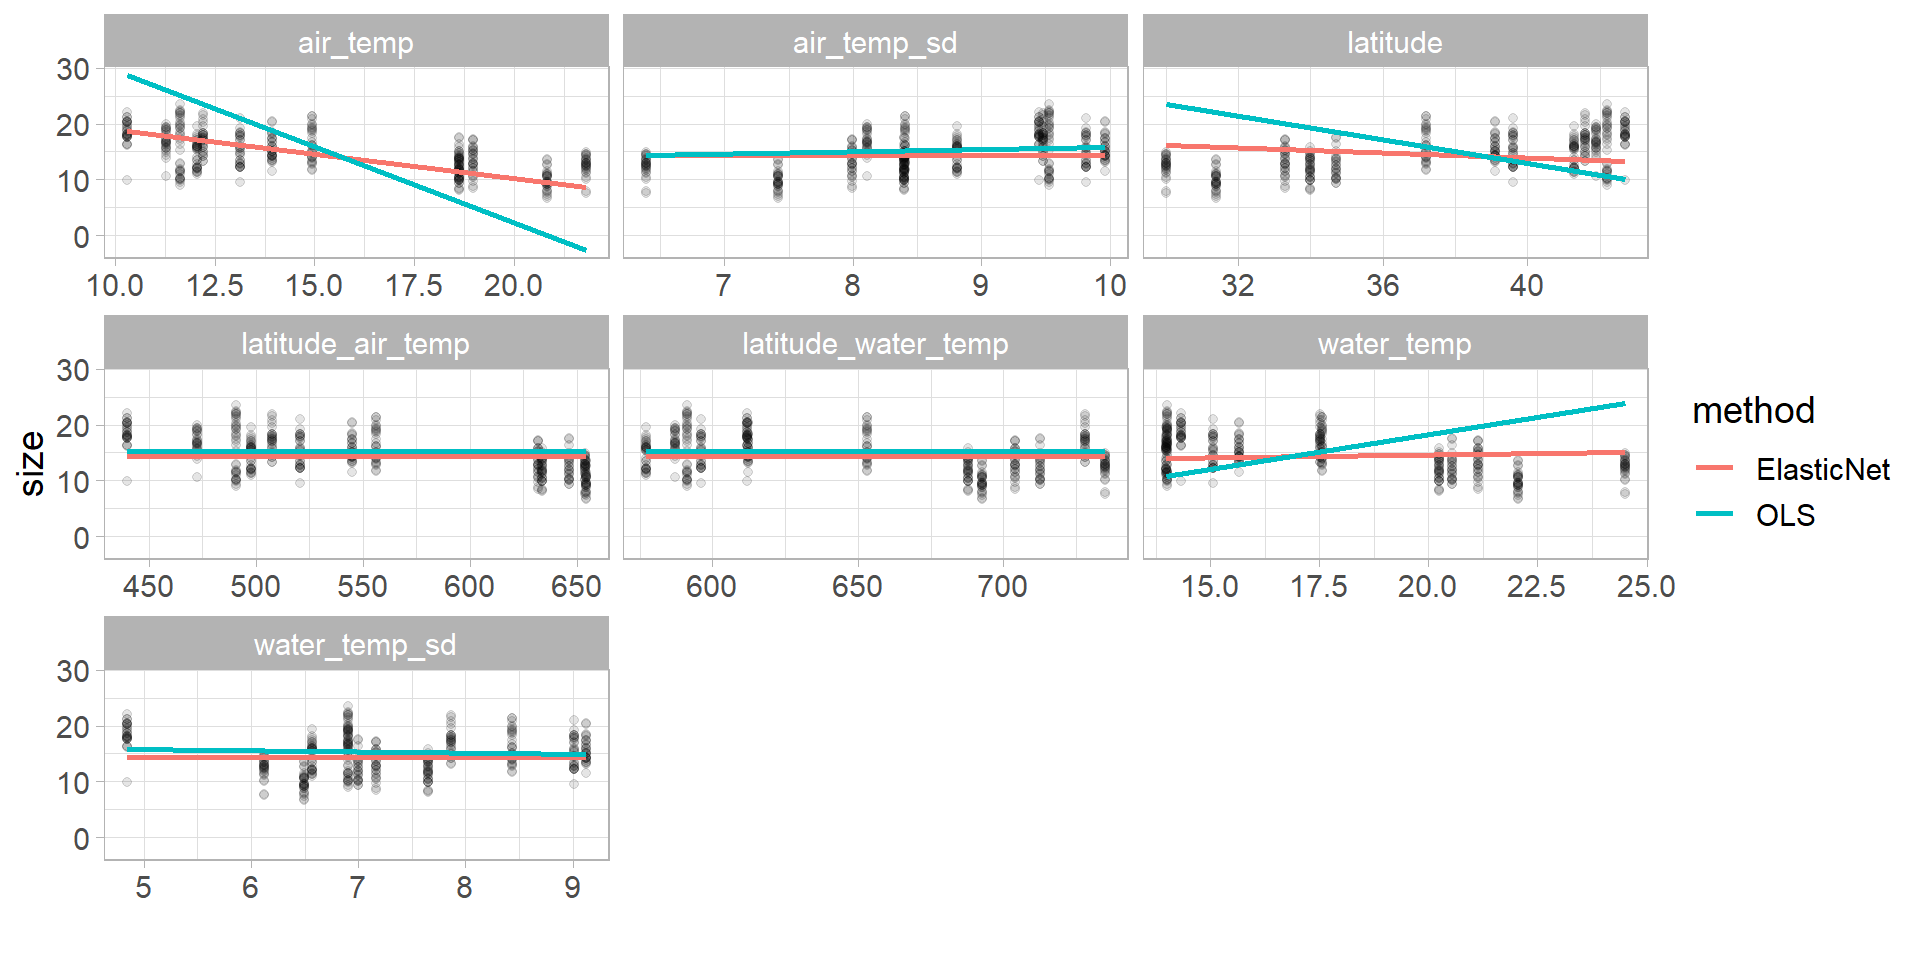
## load packages library (dplyr)library (readr)library (tidyr)library (ggplot2)library (ggfortify)library (glmnetUtils)## theme for ggplot theme_set (theme_classic ())theme_update (text = element_text (size = 14 ))## load data set <- read_csv ("data/06_crab_size.csv" )## fit ordinary least squares (linear) model and check assumptions <- size ~ latitude * (water_temp + air_temp) + air_temp_sd + water_temp_sd<- lm (model_formula, data = df_crabs)autoplot (lm_OLS, which = 1 : 2 )## fit elastic net model with cross validation <- c (0 , 0.1 , 0.5 , 0.7 , 0.9 , 0.95 , 0.99 , 1 )<- cva.glmnet (alpha = alpha_vals,data = df_crabs, nfolds = 20 )plot (elnet_cv)minlossplot (elnet_cv)<- 0.9 plot (elnet_cv$ modlist[[which (selected_alpha == alpha_vals)]])## visualize effect of lambda on predictor cofficient values <- glmnet (data = df_crabs, alpha = selected_alpha) plot (elnet_single, xvar = "lambda" , label = T)## extract coefficients coef (elnet_cv, s = "lambda.1se" , alpha = selected_alpha)## compare coefficients tibble (names = names (coef (lm_OLS)), OLS = coef (lm_OLS),elasticnet = as.numeric (coef (elnet_cv, s = "lambda.1se" , alpha = selected_alpha)))## calculate mean, min and max of all predictor variables <- df_crabs %>% select (latitude, water_temp, air_temp, air_temp_sd, water_temp_sd) %>% pivot_longer (everything ()) %>% group_by (name) %>% summarise (min = min (value),max = max (value),mean = mean (value))## make predictions <- df_crabs_summary %>% select (name, mean) %>% pivot_wider (names_from = name, values_from = mean) <- expand_grid (select (df_mean, - latitude),latitude = c (30 , 42.7 )) %>% mutate (ElasticNet = predict (elnet_cv, newdata = ., s = "lambda.1se" , alpha = selected_alpha)[,1 ],OLS = predict (lm_OLS, newdata = .),variable = "latitude" ) %>% pivot_longer (c (ElasticNet, OLS), names_to = "method" , values_to = "size" ) <- expand_grid (select (df_mean, - air_temp),air_temp = c (10.3 , 21.8 )) %>% mutate (ElasticNet = predict (elnet_cv, newdata = ., s = "lambda.1se" , alpha = selected_alpha)[,1 ],OLS = predict (lm_OLS, newdata = .),variable = "air_temp" ) %>% pivot_longer (c (ElasticNet, OLS), names_to = "method" , values_to = "size" ) <- expand_grid (select (df_mean, - water_temp),water_temp = c (14 , 24.5 )) %>% mutate (ElasticNet = predict (elnet_cv, newdata = ., s = "lambda.1se" , alpha = selected_alpha)[,1 ],OLS = predict (lm_OLS, newdata = .),variable = "water_temp" ) %>% pivot_longer (c (ElasticNet, OLS), names_to = "method" , values_to = "size" ) <- bind_rows (df_air_temp, df_water_temp, df_latitude) %>% pivot_longer (air_temp_sd: air_temp) %>% filter (variable == name) %>% select (- name) %>% mutate (variable = factor (variable, levels = c ("latitude" , "water_temp" , "air_temp" ),labels = c ("Latitude (degree)" , "Water temperature (°C)" , "Air temperature (°C)" )) )<- df_crabs %>% select (size, latitude, water_temp, air_temp, air_temp_sd, water_temp_sd) %>% pivot_longer (- size, names_to = "variable" ) %>% filter (variable %in% c ("latitude" , "water_temp" , "air_temp" )) %>% mutate (variable = factor (variable, levels = c ("latitude" , "water_temp" , "air_temp" ),labels = c ("Latitude (degree)" , "Water temperature (°C)" , "Air temperature (°C)" )) )ggplot (df_data, aes (value, size)) + geom_point (alpha = 0.2 ) + geom_line (aes (color = method), data = df_pred,linewidth = 1 ) + facet_wrap (~ variable, scales = "free_x" ) + labs (x = "" ) + theme_light () + theme (text = element_text (size = 14 )) ## Bonus: predictions for all variables <- df_crabs %>% select (latitude, water_temp, air_temp, air_temp_sd, water_temp_sd) %>% mutate (latitude_water_temp = latitude * water_temp,latitude_air_temp = latitude * air_temp) %>% pivot_longer (everything ()) %>% group_by (name) %>% summarise (min = min (value),max = max (value),mean = mean (value)) <- df_crabs_summary_all %>% select (name, mean) %>% pivot_wider (names_from = name, values_from = mean) <- df_crabs_summary_all %>% rowwise () %>% mutate (df = list (expand_grid (variable = name,"{name}" : = c (min, max),select (df_mean_all, - name))))<- bind_rows (df_prep$ df) %>% mutate (ElasticNet = predict (elnet_cv, newdata = ., s = "lambda.1se" ,alpha = selected_alpha)[ , 1 ],OLS = predict (lm_OLS, newdata = .)) %>% pivot_longer (c (ElasticNet, OLS), names_to = "method" , values_to = "size" ) %>% pivot_longer (c (- method, - variable, - size), values_to = "value" ) %>% filter (name == variable) %>% select (- name) <- df_crabs %>% select (size, latitude, water_temp, air_temp, air_temp_sd, water_temp_sd) %>% mutate (latitude_water_temp = latitude * water_temp,latitude_air_temp = latitude * air_temp) %>% pivot_longer (- size, names_to = "variable" )ggplot (df_data_all, aes (value, size)) + geom_point (alpha = 0.1 ) + geom_line (aes (color = method), data = df_pred_all,linewidth = 1 ) + facet_wrap (~ variable, scales = "free_x" ) + labs (x = "" ) + theme_light () + theme (text = element_text (size = 14 ))